Fire has affected wildlands in the southern Cascades and Sierra Nevada mountains for thousands of years. Historically, lightning-ignited fires resulted in mixed-severity effects on small sections of the Lassen landscape. Today, the cumulative effects of fire suppression and climate change are fueling larger and hotter wildfires resulting in more high-severity effects. Fire ecology research within the park and Lassen region help us to understand historic and present-day fire regimes and anticipate the effects of fire into the future. 
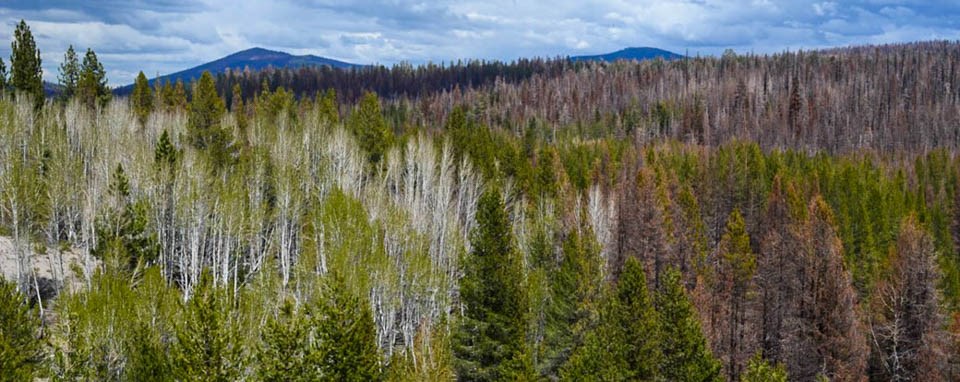
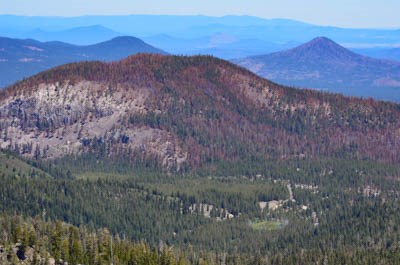
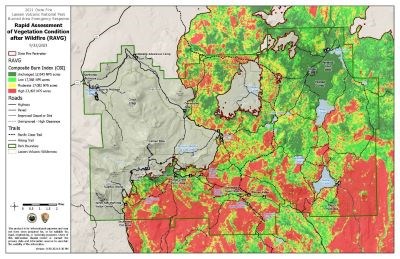
Fire Regimes and EffectsPre-suppression fire regimes in the Lassen region were classified as mixed-severity with fires occurring an average of every 5 to 15 years. The introduction of wildfire suppression activities in 1904 resulted in significant changes to fire regimes within the park and region. These shifts in fire regimes resulted in significantly longer fire cycles, increased forest density, and changes in types of trees. Historic Period1656-1904 (Pre-Suppression)Prior to 1904, lower elevation forests naturally had more frequent fire than higher elevation forests because they are warmer and drier and typically have more flammable fuels. Fires generally resulted in mixed-severity effects on vegetation. This creates a mosaic, or quilt-like pattern, of low-, moderate-, and high-severity, and unaffected patches. These diverse patches help make a landscape more resilient to drought and future wildfires. 1905-1980s (Suppression)Fire suppression activities initiated in 1904 resulted in a dramatic decline in fire frequency. During this time, land managers actively suppressed most lightning-ignited fires. Over time, this resulted in denser forests with larger numbers of younger trees (which previously killed by fire) and changing proportions of each species type. Current Period1980s-2000sIn the 1980s, Lassen Volcanic began to limit its suppression efforts of lightning-ignited fire within its newly established Wilderness area. In the decades that followed, Lassen Fire Management used minimal intervention to allow the return of natural fire regimes in Lassen Volcanic Wilderness. These lightning-ignited and prescribed fires ranged from 18 to 3,500 acres in size and resulted in mixed-severity effects. 2010->In the past decade, the park and Lassen region have seen dramatic increases in the size and severity of wildfire. The cumulative effects of fire suppression and climate change now fuel larger and hotter wildfires. The 2012 Reading Fire (16,098 park acres) and 2021 Dixie Fire (73,240 park acres) each far exceeded the size of previous wildfires. More than half of the Dixie Fire footprint in the park experienced low- to moderate-severity effects due in part to fire management in the previous decades. However, one-third of the affected park area experienced high-severity effects that are concentrated within the southeast area. Since historic fire regimes did not reach this magnitude of size or severity, Lassen Volcanic and its partners within the Lassen region are using scenario planning to consider implications for the future. What is a Fire Regime?As all forests are not alike, neither are the types of fire that burn in them. Fire managers need to know about the characteristics of a fire regime to effectively manage and restore fire. A fire regime is the naturally-occurring pattern of fire in a particular vegetation type or specific location. Fire regime characteristics include:

What is Burn Severity?The National Park Service uses vegetation burn severity to measure the effect on vegetation resulting from fire, specifically mortality and biomass consumption. One measure of burn severity is called the Composite Burn Index (CBI) and is based on the combined effects to the understory vegetation (grass, shrub layers), midstory trees, and overstory trees. CBI measures the loss of basal area (number of live trees) and changes in canopy cover (green layer of branches and crowns of plants or trees). 
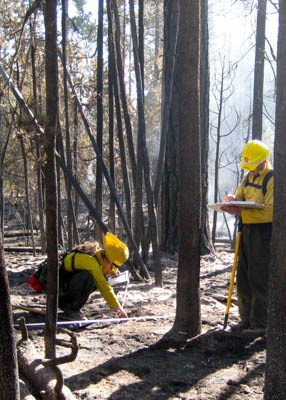
Tracking Fire Effects over TimeA National Park Service Fire Monitoring Program began in the 1980s. This program uses long-term monitoring locations or plots, to track how trees and shrubs respond to lightning-caused fires and prescribed burns. Ecologist record how many individuals of each species are present before and after fire and measure the amount of fuel (dead branches, logs, pine needles, and other materials on the ground that can burn). |
Last updated: November 7, 2023
