Part of a series of articles titled The Midden - Great Basin National Park: Vol. 18, No. 2, Winter 2018.
Article
Air Temperatures in Lehman Caves
This article was originally published in The Midden – Great Basin National Park: Vol. 18, No. 2, Winter 2018.

We recorded and analyzed air temperature year-round in Lehman Caves to explore the impacts of tourism and the external climate on the cave microclimate. Stark conducted an early study (1969) on effects of cave tourism on climate in the cave. After almost 50 years it was time for a new look.
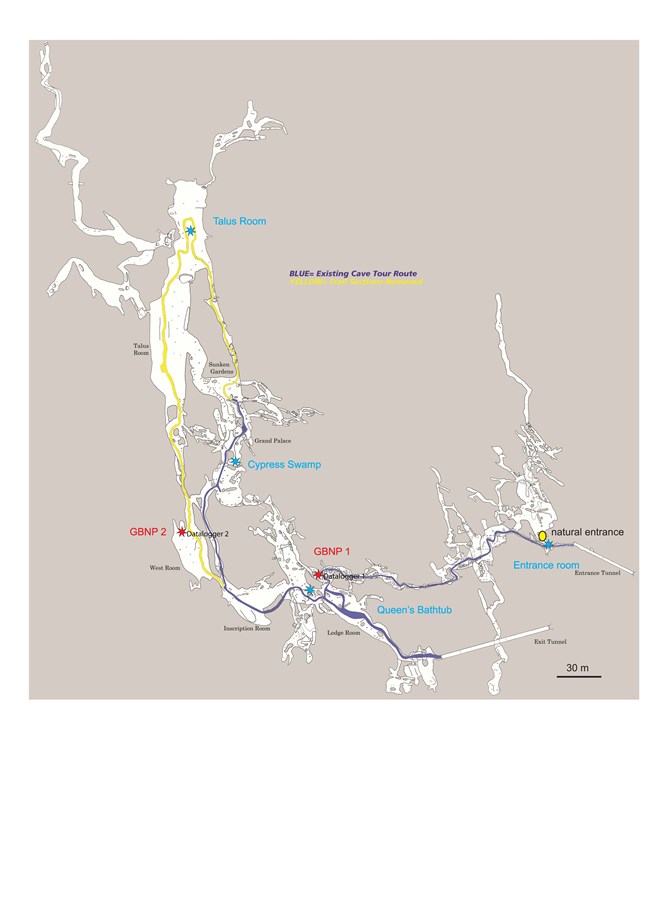
Two Van Essen data loggers were placed in the cave for this study on 6 August 2015 (Stations GBNP 1 and GBNP 2). Accuracy of the measurements was ±0.01 °C. Four other air temperature monitoring stations – Entrance Room, Queen’s Bathtub, Cypress Swamp, and Talus Room – had already been established. The sensors were distributed at varying distances from the cave entrance. Two were off of the current cave tour route.
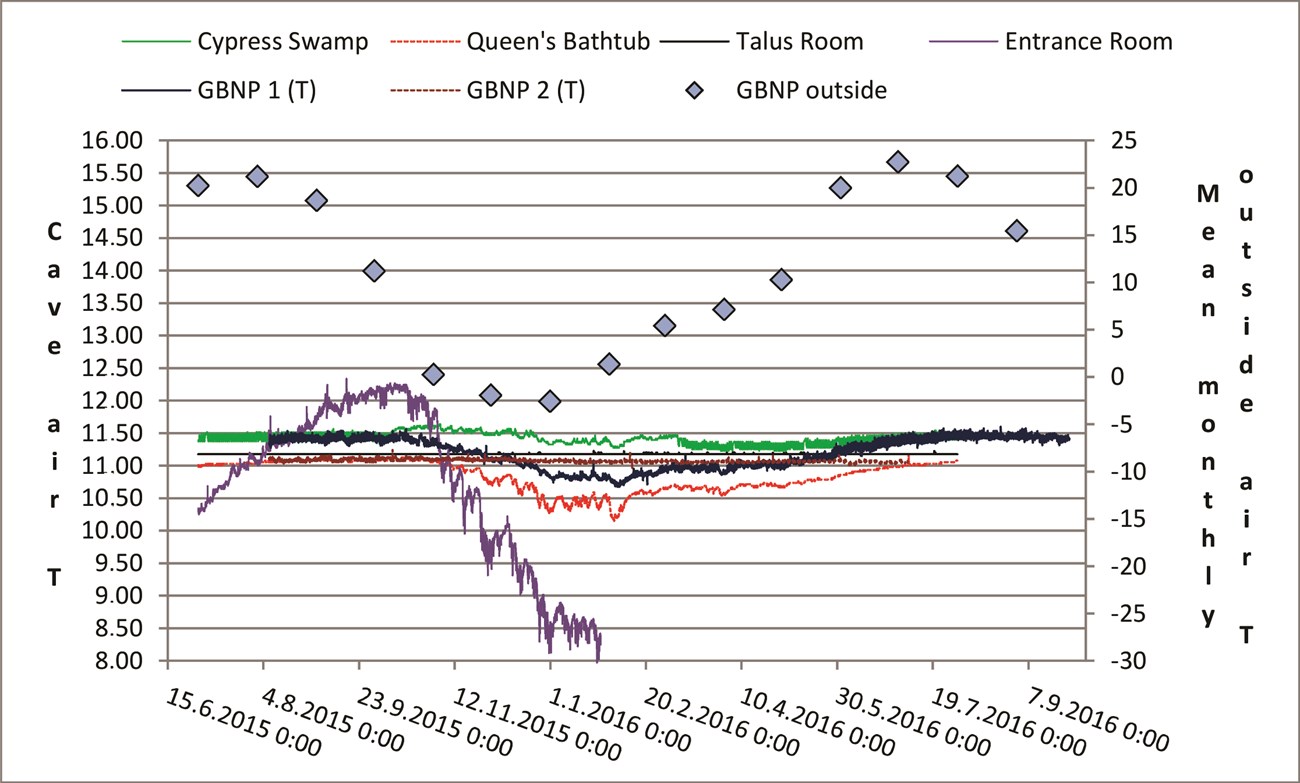
The hourly cave air temperature data were compared with outside mean monthly air temperature values (Fig. 1).

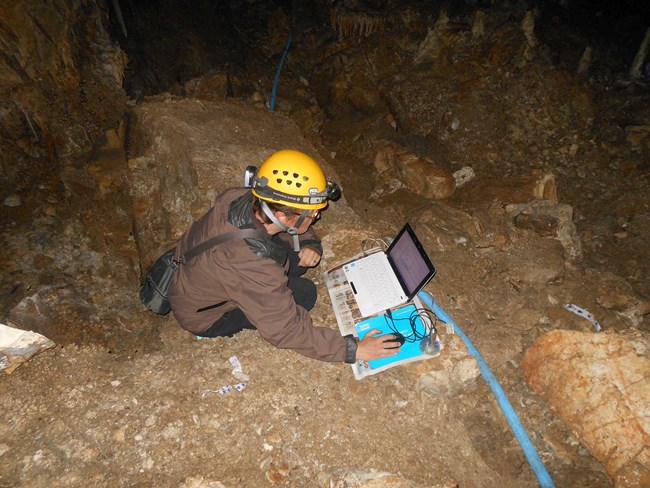
Temperatures at the other stations reflect the wintertime ventilation regime of outside air entering the Downloading dataloggers in Lehman Caves. cave through the natural entrance (the “chimney effect”). Temperatures at the Entrance Room station range widely, over about 4°C. Stations GBNP 1 and Queen’s Bathtub are close together, about midway along the extent of the cave tour route. Temperature fluctuations are similar for the pair, ranging over about 1°C. At the Cypress Swamp station, which is further from the entrance but also along the cave tour route, seasonal fluctuation is reflected weakly.
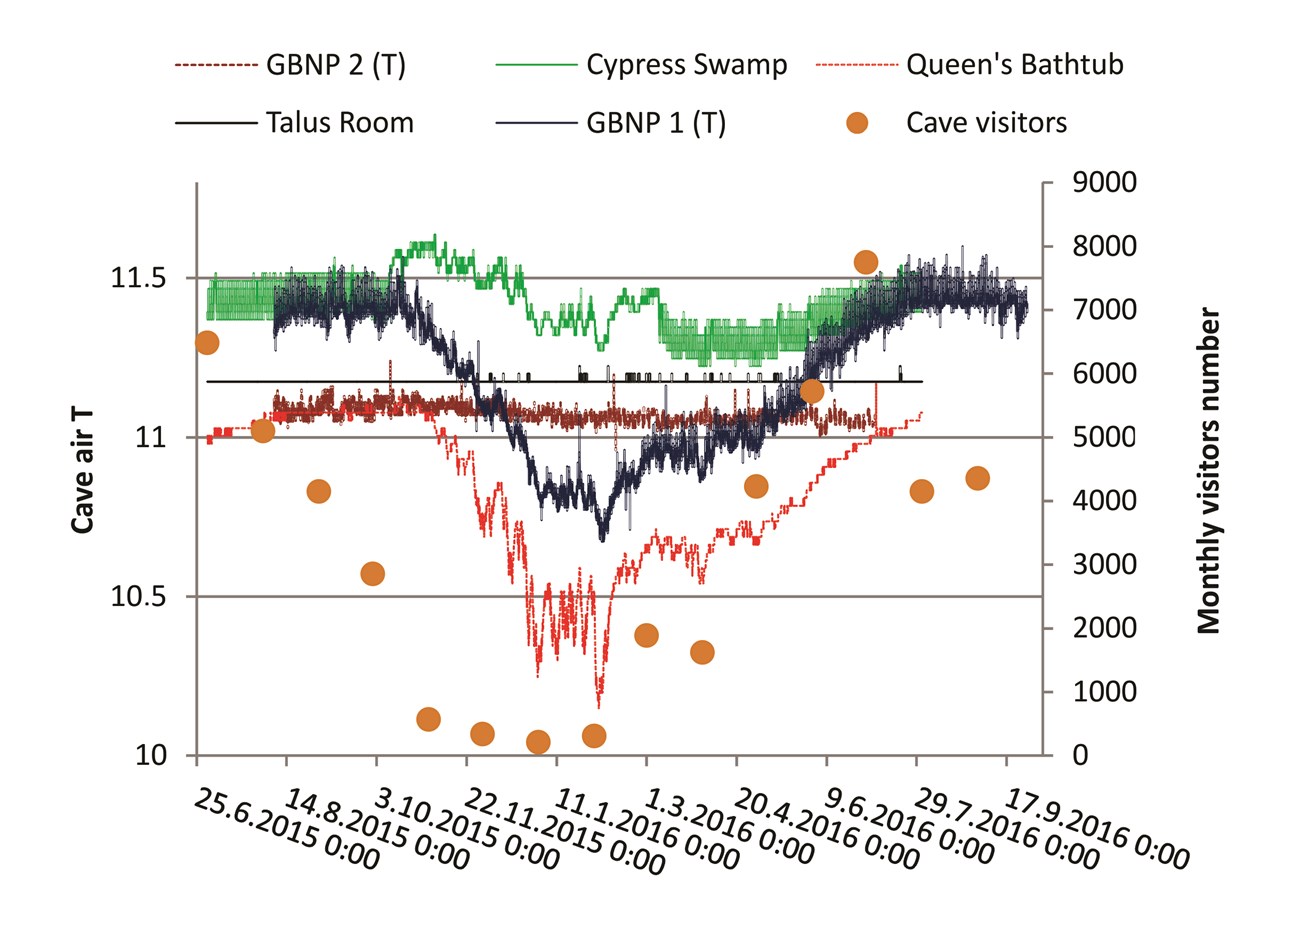
In Lehman Caves the chimney effect is most visible in winter. When outside air temperature is less than cave air temperature we see air temperature decrease at the stations closest to the natural entrance (Fig. 2). During summer, the cave air is warmed by entry of warmer outside air but also by increased visitors (increased human presence and use of lighting). Seasonal fluctuations are not seen at all off the tour route in the Talus Room and West Room (GBNP 2). The stations along the tour route show characteristics of a so-called thermal cave, where the air flow clearly differentiates between summer and winter. Barometric caves, in contrast, show only small differences in air temperature between summer and winter – as applies to the Talus and West Rooms.

Caves and mean monthly outside temperature from July 2015 to August 2016.
At Queen’s Bathtub and GBNP 1 stations, cave air temperature remained elevated until October 2015 – two months after visitation declined for the season (Fig. 3) and about 1 to 2 months after outside air temperatures dropped (Fig. 2).
Mean year-long outside air temperature for the period 1 July 2015 to 1 July 2016 is 9.2 °C, which is 1.9 °C (~20%) lower than the year-long average cave air temperature at GBNP 1 (computed over a slightly different time period: 7 August 2015 to 7 August 2016). Two factors may be contributing to this difference: (1) natural heat flux from the Earth’s interior; and (2) heat emanating from visitors and lighting in the cave. Elevated natural heat flux from the Earth’s interior is probably not applicable for Lehman Caves because there are no known hot springs or other signs of active volcanism in the vicinity (radius 20 km). But more research related to this possibility is warranted.
Little Muddy Cave, located near Lehman Caves (0.5 km distant and about 100 m lower elevation), is not a show cave. Its mean air temperature from November 2005 to November 2006 was 9.7 °C. This is 1.5 °C lower than the mean cave air temperature at Lehman Caves (Stations GBNP 1 and Talus Room), closer to the outside air temperature (9.2 °C). This information further supports the hypothesis that cave air temperature at Lehman Caves is elevated anthropogenically.

Our findings support the hypothesis that anthropogenic factors are causing a rise in Lehman Caves’ air temperature above natural levels. However, further research would be needed to confirm the hypothesis.
Acknowledgments This study was performed within the project Climatic monitoring in show caves: comparison of conditions from Slovene karst caves with karst areas of east-central Nevada USA (GRBA-2015-SCI-0015) and Slovenia-USA bilateral project (BIUS/15-16-054).
References Stark, N. (1969). Microecosystems in Lehman Cave, Nevada. NSS Bull. 31(3), 73-81
Last updated: February 26, 2024
