Last updated: August 23, 2022
Article
Bering Land Bridge National Preserve/Nome Weather Summary Fall 2021, Winter 2021-2022, and Spring 2022

NPS/Ken Hill
We monitor and record weather data in Bering Land Bridge National Preserve to help understand daily, monthly, and seasonal weather patterns and shifting climate averages that influence the health and abundance of the plants and animals that live in the Preserve and the hydrologic systems that support them. We also track the weather extremes that cause disturbance such as drought, floods, heat waves, cold snaps, and high winds. The data are collected and analyzed along with other park ‘vital signs’ to provide a holistic view of how these high latitude park lands are changing. The weather station in Nome has been recording temperature and precipitation data for over a hundred years. We use that information to provide context for the changes we are seeing today inside the Preserve.

Fall of 2021 was cool and dry in Nome
The average temperature for the fall season was 5.1 °F cooler than normal. November was by far the coldest of the autumn months coming in almost 14 °F colder than normal. It was the 5th coldest November in 114 years (Fig. 1). This is completely opposite of November 2020 which was the 4th warmest on record. November 2021 was the coldest November to date at Serpentine Hot Springs. We started recording the temperature at this site in 2011. Last November the average temperature there was 21.1 °F and this past fall it was 1.3 °F! It was the second coldest November at the Devil Mountain site in the northern part of the Preserve. It was a dry fall season with each month coming in below normal. Not much precipitation fell during the cold month of November (Table 1).


NPS/Image from a remote camera on the climate stations at Serpentine Hot Springs
The winter of 2021/2022 was cool and wet
December brought extreme precipitation and rain-on-snow along the West Coast of Alaska and into Interior Alaska. Heavy snowfall, freezing rain, and rain brought record amounts of precipitation to many communities. Nome had its wettest December on record! 3.96 inches of precipitation was recorded in December (melted snow and rain), which is 377% of normal. Temperatures after mid-month climbed above freezing and the precipitation that fell was likely a combination of rain and snow. There were several very wet days in December. The wettest day was December 19 when 0.58 inches of precipitation was recorded. Between December 24th and 26th , an atmospheric river originating in the tropical Pacific brought an incredible 1.28 inches of precipitation to the Nome area in the span of just a few days. The normal total for the entire month of December is 1.05 inches. This plume of moisture impacted most of the communities along the west coast of Alaska into the central Interior of the state north of the Alaska Range. An image from Serpentine Hot Springs shows the ground conditions after the December 19th warm rain event (right). January and February were on the cool dry side, but the total winter season precipitation still ended up above normal by 0.68 inches.Winter temperatures for 2021-2022 continued the cooler than normal trend with the persistence of a La Niña into a second winter season. La Niña, in general, means cooler temps for Alaska (Fig. 2). Even with a few warm storm events, December was much cooler than normal at the start of the month. Each month of the winter season had cooler than normal winter temperatures. December and February temperatures were just below normal, while January was the chilly winter month, almost 5 degrees F cooler than normal (Table 2). A few warm periods occurred in late December and late February. A new record high of 41°F was observed on February 25 (Fig. 3).
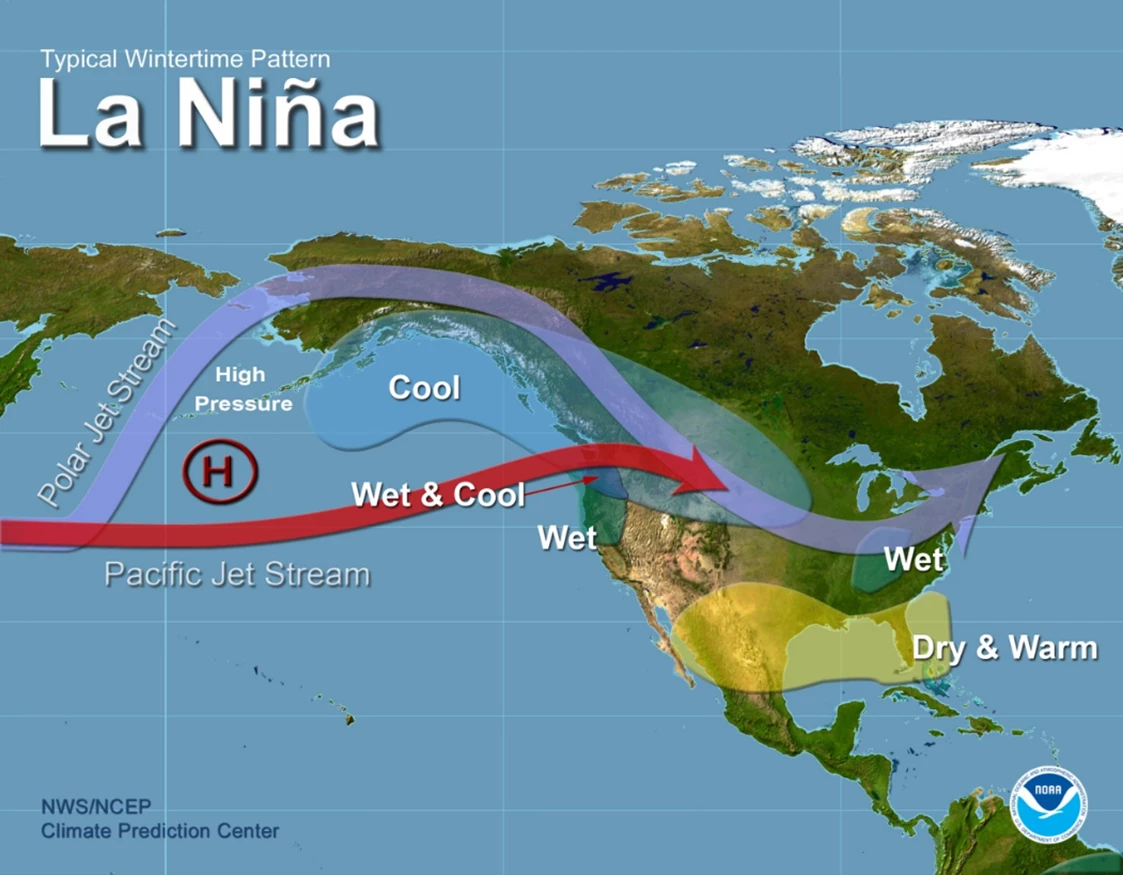
Courtesy NWS/NCEP Climate Prediction Center.


The spring season was warm and dry
The average temperatures for March, April, and May were warmer than normal in Nome. March was almost 7 degrees F warmer; April was a little more than 5 degrees warmer; and May was just over 1 degree F warmer than normal. Record high temperatures were recorded on May 20 and 23 (Figure 3). The spring season temperature ended up 4.4°F warmer than the 1991-2020 normal. Since 2014 the average spring season temperatures have been in the normal to above normal range. The same holds true at Serpentine Hot Springs where the average spring temperature over the past nine years has been ~ 10°F warmer than when we started taking measurements in 2012 and 2013. In Nome, spring 2022 was the 9th warmest on record.The spring is generally the driest season for the region and this spring was no exception. There was less precipitation than normal in an already dry season. There were only four days with measurable precipitation during March. The beginning of May was wetter than late May and the total was just shy of the normal 0.89 inches expected for the month.


Summer 2022 (through August 11)
June was 2.4°F warmer than normal in Nome. June 4-9 was the warmest period of the month with temperatures s averaging 15 degrees F above normal (Fig. 5). The rainfall total for June was just about normal at 0.95 inches; the 30-year average (normal) is 0.99 inches. The rainfall total for July was above normal for July with 3.11 inches, normal is 2.35 inches. On July 20th a total of 1.07 inches of rain was recorded, a new daily record. The average temperature for July came in just 0.1°F above normal. The beginning of July was warmer than normal, but by mid-month temperatures cooled off with a few days nearing record minimum territory. August started out warm, but after the 5th temperatures moderated to near normal. So far, the rainfall totals for August are about 60% of normal with a total of 0.64 inches through August 11. We’ll update the full summer statistics in the fall.

For more info, contact:
Pam Sousanes, Physical Scientist907-455-0677
pam_sousanes@nps.gov
Ken Hill, Physical Scientist
907-455-0678
kenneth_hill@nps.gov