Last updated: March 11, 2025
Article
Using Growth Rings to Determine Ages and Growth Patterns of Trees in Big Cypress
In seeking answers to important stewardship and management questions, researchers at Big Cypress National Preserve found that the oldest trees measured were of the smallest species, that some trees grew slowly—as little as 0.06 inches per year on average, and that all species’ growth was most influenced by water levels.
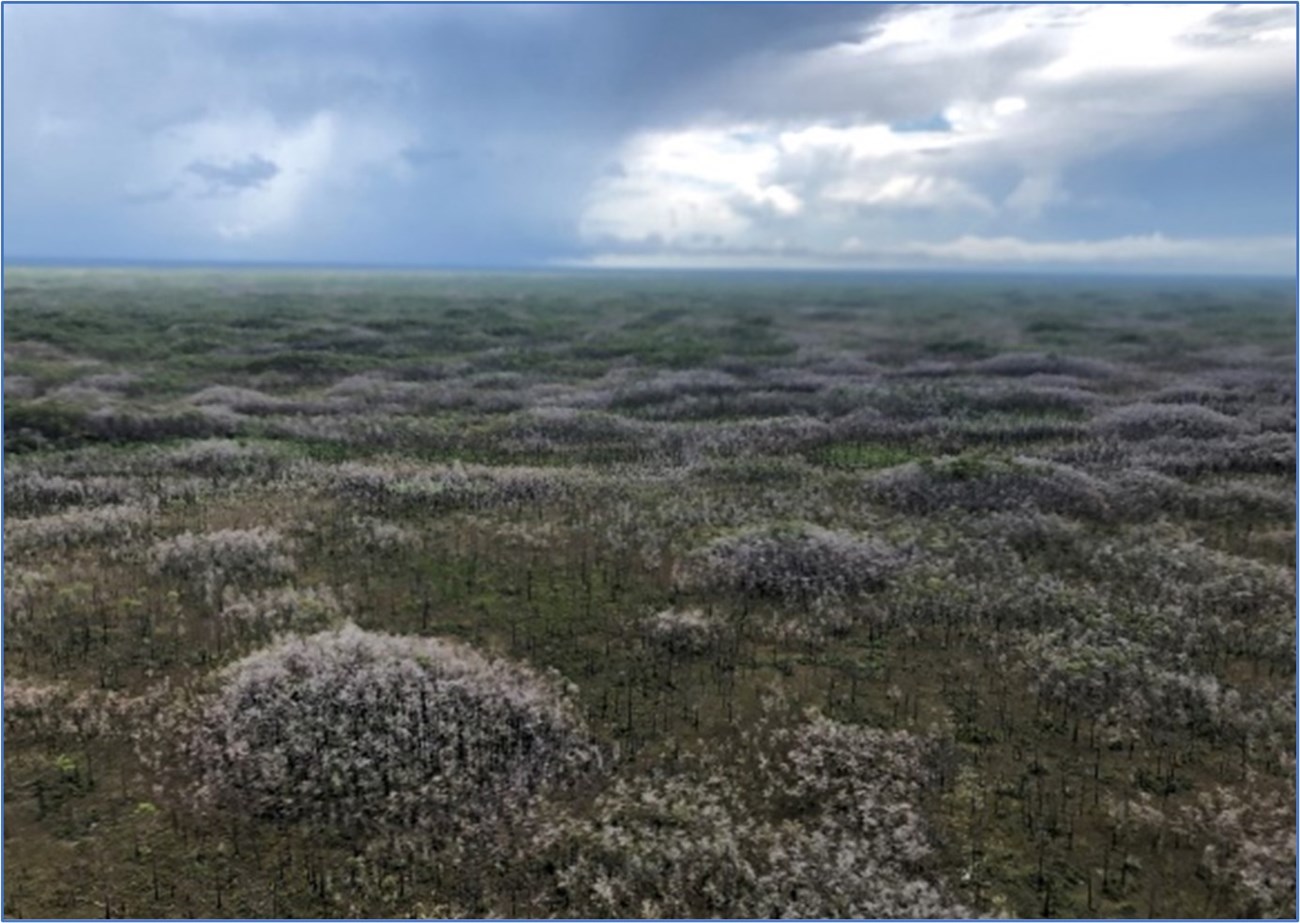
NPS / Courtney Angelo.
Big Cypress National Preserve (also, the Preserve; Big Cypress), named for the vast expanse of cypress trees across the landscape, is a freshwater swamp ecosystem in southwest Florida. The Preserve spans almost 729,000 acres (295,000 hectares) and contains more than 1,000 temperate and tropical plant species. These species include the three most dominant tree species on the landscape—pond cypress (Taxodium ascendens), bald cypress (Taxodium distichum), and slash pine (Pinus elliottii). Big Cypress contains the largest population of pond cypress in the southeastern United States, and pond and bald cypress together dominate about one-half of the Preserve’s landscape. Even with the trees’ commonness, Preserve managers have many questions about the trees’ growth patterns and age. To answer these questions, they turned to scientific researchers.
But first, some Background...
Where do these Dominant Trees Grow?
Some pond cypress in the Preserve grow in a stunted, or “dwarf,” manner due to their living in nutrient-poor soil or harsh conditions. Pond and bald cypress trees grow in cypress forests cypress domes, cypress strands, and cypress prairies. Although both species can be found in each of the cypress forest types, bald cypress trees typically dominate domes and strands, while dwarf pond cypress typically dominate cypress prairies. In comparison, slash pine grow in pine forests, or pinelands, that are found in the drier, more upland portions of the Preserve.
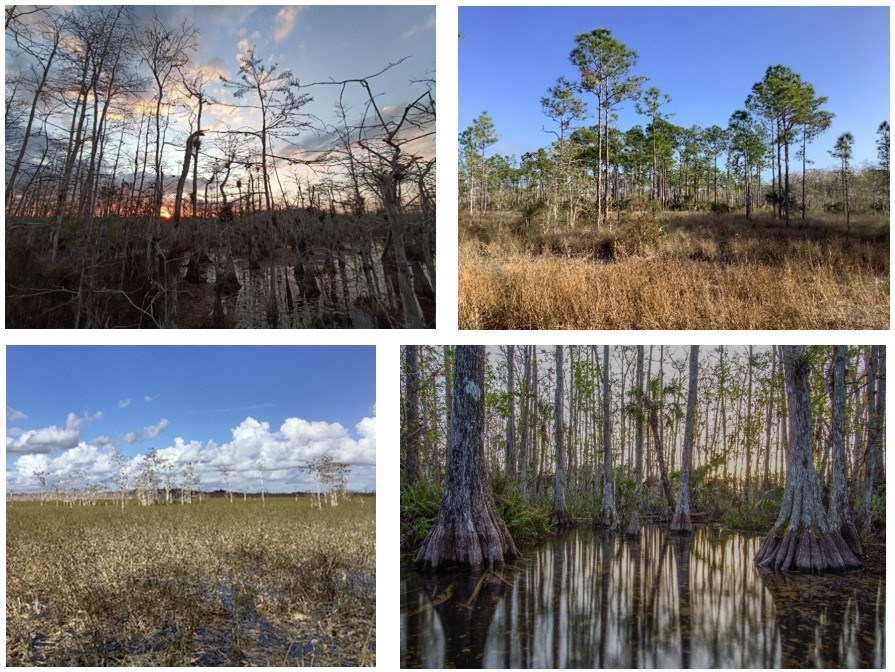
Top left photo by NPS / Manuel Bernal-Escobar; top right and bottom left photos by NPS / Robert and Janie Hinson; and bottom right photo by NPS.
What Forces Shape the Landscape?
These and the other vegetation communities in Big Cypress are shaped by water. The vast majority of the Preserve landscape (~90%) is rainfall driven. During the wet season (usually ~May–October), large amounts of rain fall on the Preserve, flooding the land with surface water. During the dry season (usually ~November–April), the water levels drop slowly, exposing dry ground in some areas. Areas of higher elevation are flooded for only a few weeks or even just a couple of days each year, while the lowest parts of the Preserve can remain underwater for most of the year. The uplands where pines occur, for example, are flooded with water for only about 20–60 days per year, while cypress domes and cypress strands are typically flooded for about 250–300 days per year.
In addition to seasonal changes in water levels, plant communities in the Preserve often experience natural fires, tropical storms, and hurricanes, as well as human disturbances and pressures (such as off-road vehicle use, oil exploration, invasive species, and climate variability). Over the last century, average annual temperature, total annual precipitation, and average annual vapor pressure deficit have all changed at different rates, but changes have generally been most dramatic since the 1980’s (PRISM Climate Group 2023).
Questions for the Current Study
Due to the potential influence of climate variability and other human-related disturbances of the Big Cypress landscape, and because knowledge of national parks and preserves is vital for the management and protection of their resources, Preserve managers and scientists sought answers to several important questions about the dominant trees on the landscape. These questions included:
- How old are the trees in Big Cypress National Preserve?
- How fast do the different dominant tree species grow?
- How do age and growth rates of trees change across the Preserve landscape?
- Are growth rates of the trees sensitive to climate, water levels, and/or other factors?
Preserve managers turned to researchers at the University of Miami, Coral Gables, Florida, to answer these questions. Starting in 2021, the researchers used dendrochronology methods to take a closer look at the ages and growth rates of trees in Big Cypress. What’s dendrochronology? Keep reading to find out (and see if you can say “dendrochronology” three times fast)!
Dendrochronology and Growth Rings
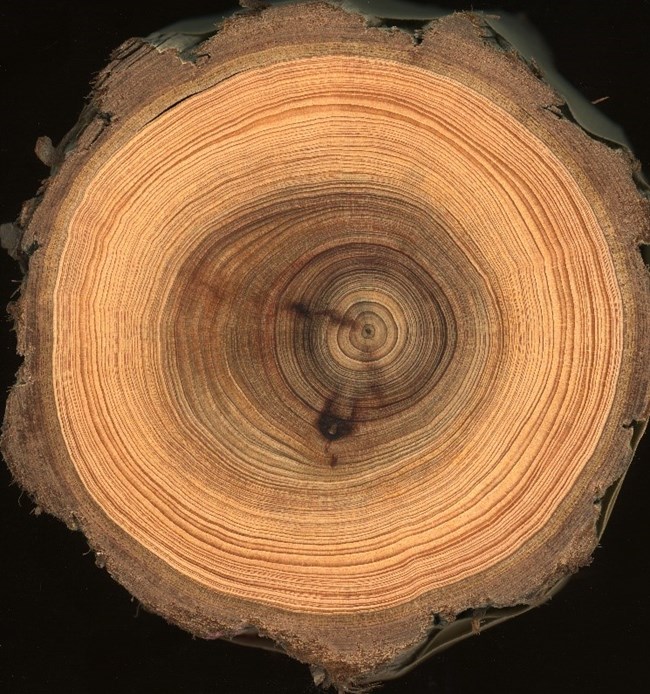
NPS / Manuel Bernal-Escobar.
Dendrochronology is the science of measuring and counting tree rings (annual growth rings), assigning calendar years to each of them, and finding common growth patterns among trees to estimate the climate of the past. Dendrochronologists can determine the age of trees, how fast they grew in different years, and what factors influenced their growth rates.
How Did Researchers Study the Trees?
Here are some key aspects of how researchers conducted the study. See the full report (Bernal-Escobar et al. 2025) for additional details.
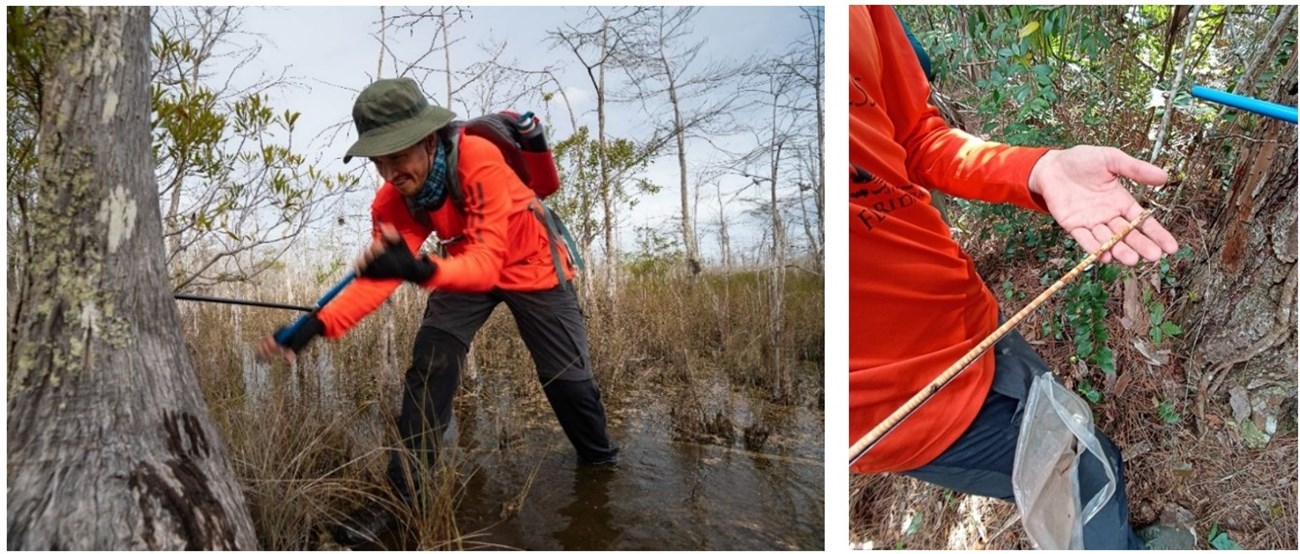
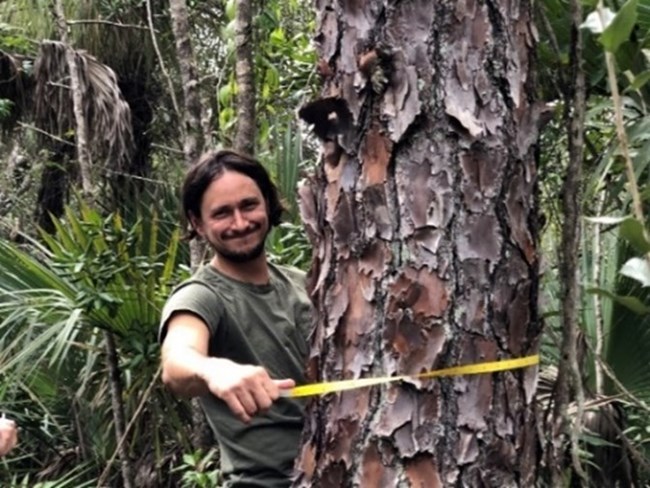
- The study area was in the northcentral portion of Big Cypress (Figure 1). Researchers sampled cypress trees that were growing in and around 10 cypress domes and slash pines growing in nine pinelands. All sampled trees were all along the Florida Trail, between approximately 0.5 and 3 miles (0.8 and 5 kilometers) south of Interstate 75. Researchers sampled trees that were growing at various distances from the centers of the cypress domes or the edges of the pinelands. In all, they collected wood cores (described below) from 22 pond cypress, 26 bald cypress, and 25 slash pine trees, all mature and healthy individuals. The samples were taken to the University of Miami for processing and measuring. In addition, the researchers included some cross sections from trees that were cut down in the Preserve around 2018; a photo of one of these cross sections is shown above.
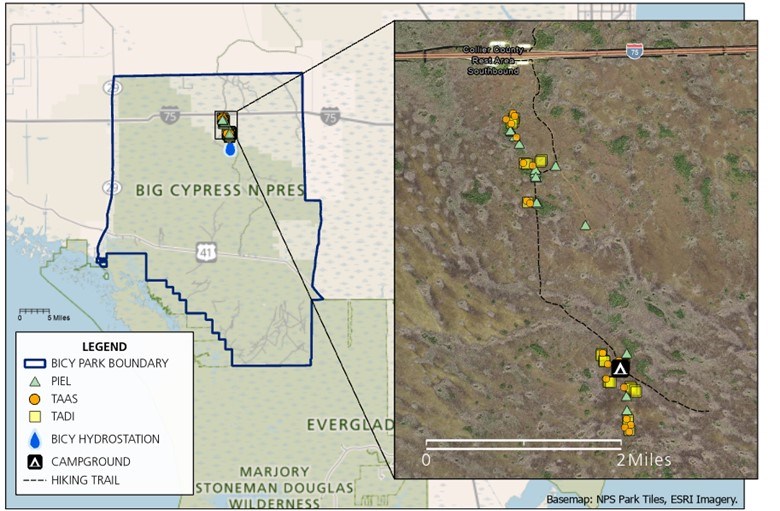
NPS adapted from Bernal-Escobar et al. (2025).
NPS / Alyssa Kullberg (left), NPS / Manuel Bernal-Escobar (right).
-
Back in the lab, researchers processed the samples. This included drying the samples in an oven at 60°C (140°F) for two days. Then, to prevent the samples from breaking, they glued the cores into wooden frames. Next, researchers sanded the samples to accentuate their features. Finally, they scanned the samples on a high-resolution scanner (3600 dpi) so that they could measure the samples using a computer with specialized software (see next bullet).
- Researchers manually identified and marked the boundaries of annual growth rings on all cores in the scanned images using a computer program. They then used a tool within the software to estimate the tree’s age and to measure the width of growth rings, from the bark to the center of the trunk, with a maximum precision of 0.001 millimeters (that’s 0.00004 inches)! See figure below.
As part of estimating the tree’s age, researchers construct a time series (see graph at the bottom of the image). The red line in the time series shows the sample growth pattern, and the black line shows the average pattern from all the pond cypress in the study. When these two patterns align, researchers can say the samples are successfully cross-dated.
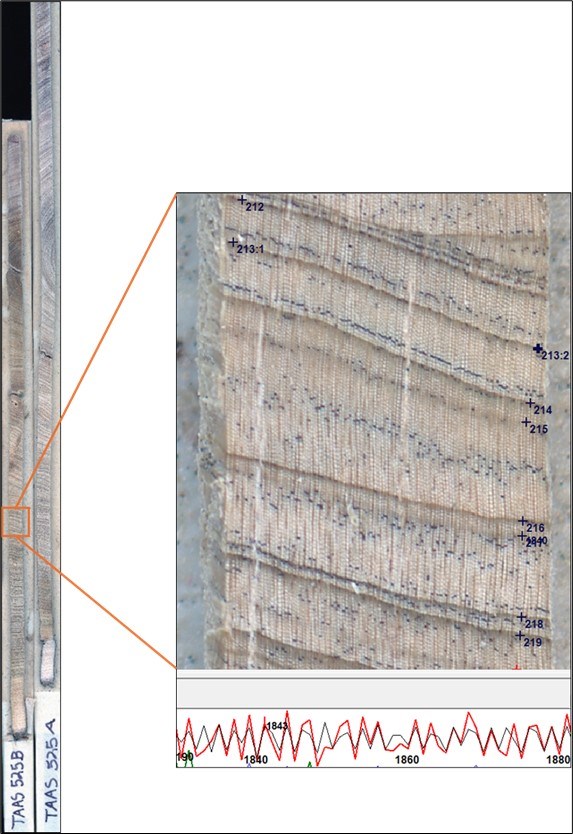
Image credit: NPS / Manuel Bernal-Escobar.
-
To study the relationships between tree growth and aspects of the climate, researchers obtained climate data from the PRISM database (PRISM Climate Group 2023). These data included monthly total rainfall, monthly minimum average temperature, monthly average annual temperature, monthly maximum average temperature, monthly minimum vapor pressure deficit, and monthly maximum vapor pressure deficit, from January 1895 to January 2022. To estimate the effect of hydrology on tree growth, researchers used water depth data collected by the Everglades Depth Estimation Network (EDEN) (Telis 2006) for 1990 to 2021.
-
Researchers used statistical analyses to test for relationships between tree growth rates and spatial variables (such as, the distance of each cypress tree to the center of the nearest cypress dome, and the distance of each slash pine to the closest edge of the pineland in which it was growing, and the distance from each tree to the nearest point of Interstate 75). The interstate is known to affect water flow between areas to the north and south of it.
What did Researchers Find?
The Trees are Much Older than We Are
Many of the trees in Big Cypress are older than us! Researchers found that the overall range in ages of the trees that they sampled was 31 to 289 years. The average age of the slash pines sampled was 67 years, ranging from 31 to 152 years. The average age of the bald cypress sampled was 88 years, ranging from 32 to 219 years, and the average age of the smallest tree species, pond cypress, was 174, ranging from 52 to 289 years. Out of the trees sampled, the smallest species was the oldest!
Some Trees Grow Faster than Others
Growth rates varied between the species. If it was a race for the fastest, however, the winner was.... slash pine! Out of the individuals sampled, slash pine trees grew thicker (that is, larger in diameter) by an average of 6.1 mm/year (0.2 inches/year). Bald cypress came in second place, growing thicker by an average of 5.3 mm/year (0.2 inches/year). And finally, in last place was pond cypress, which grew just 1.6 mm/year (equal to 0.06 inches or 6/100 of an inch per year!).
How do these growth rates compare to those of trees in other areas? Other researchers have reported average growth rates of tropical trees as 3.3 mm/year (in tropical conifer forests), and average growth rates of temperate trees as 2.3 mm/year (in temperate conifer forests) (Locosselli et al. 2020). All three species in the Big Cypress study are conifers growing in a subtropical climate. Both slash pine and bald cypress grew much faster, on average, than average rates reported for tropical conifers and temperate conifers, while pond cypress in the Preserve grew much slower.
Standing Water Levels are Key
Researchers found that growth rates in the Preserve’s dominant tree species were most influenced by water levels—that is, standing water levels. [And because the Big Cypress landscape is rainfall driven, standing water levels are related to rainfall]. However, correlations between tree growth rates and other climate variables were generally weak.
Researchers found differences between the three tree species in when water levels were most important for growth. They found that:
- Slash pine grows faster in years with higher* water levels during April and May.
- Pond cypress grows faster in years with higher* water levels in June.
- Bald cypress grows faster in years with higher* water levels from May to October.
*By “higher” water levels, we mean water levels higher than the average water level—0.25 meters (0.82 ft)—for the study site vicinity from 1990–2021.
Researchers also found that growth rates of slash pine were positively related to the distance to the edge of the pinelands—trees grew faster the farther away they were from the closest pineland edge, and they grew slower when they were closer to the pineland edge. This may be due, at least in part, to slash pines having trouble growing if their roots are in water or in saturated soils (Foster and Brooks 2001, Harley et al. 2015). Cypress trees have special adaptations that allow them to grow in water, but slash pine trees do not. Other factors may also be involved. Growth rates of cypress species were not related to distance to the center of cypress domes.

Photo: NPS / Robert and Janie Hinson.
Importance and Implications of the Study
Tree rings have played an important role in characterizing patterns of tree growth in many species, but they have only rarely been used to study pond cypress, and have never been used before for trees in Big Cypress National Preserve. Given the quality of the pond cypress chronology from this study, and the good correlations with water levels, the chronology could be used to help reconstruct June water levels (and therefore precipitation) more than 100 years into the past. This information can help inform our understanding of environmental changes over time in Big Cypress. In turn, this information can help Preserve managers make more informed resource management and stewardship decisions.
If precipitation and/or standing water levels change in the future (overall amounts and/or the timing), trees in Big Cypress would be impacted. Researchers see some evidence of growth rates changing through time in this study. Scientists with the NPS developed a park-specific summary of climate exposure for the Preserve, which included two plausible climate futures referred to as “warm-wet” and “hot-dry.” The two climate futures (future being 2035–2065) vary in the amount of warming that could occur and changes in precipitation and drought, but the futures have commonalities. Both futures are predicted to result in warming temperatures in all seasons, an increase in the largest 24-hr rainfall event, and an increase in average drought severity.
The slow growth rate of pond cypress, especially, means that recovery of these trees following disturbance would be a very slow process—taking many decades to centuries. The same is true, to a somewhat lesser extent, for bald cypress and slash pine.
For More Information
If you’d like to read more about this topic, here are some suggestions:
-
Here’s an article that’s focused on young readers, but it’s really of interest to anyone. It’s written by the scientists who conducted the dendrochronological study at Big Cypress National Preserve: How Old are Trees and How Fast Do They Grow?
-
This NPS article discusses archeological sites, but it also provides a description of dendrochronology and its history and methods: Dendrochronology - Tonto National Monument (U.S. National Park Service) (nps.gov).
-
If you’re interested in learning about the use of dendrochronology methods to study the ancient cliff dwellings at Tonto National Monument, Arizona, this NPS article is for you: Dendrochronology at Tonto National Monument (U.S. National Park Service) (nps.gov).
This article is based on the work described in the following report, funded by the NPS Natural Resource Condition Assessment Program:
Bernal-Escobar, M., C. L. Angelo, and K. Feeley. 2025. A Dendrochronological Assessment of Growth Rates in Three Dominant Tree Species of the Big Cypress National Preserve (Florida, USA). Report to National Park Service, Big Cypress National Preserve. Note: The report is in preparation and a link will be provided here soon.
NPS / Riley Fortier.
Additionally, the work described here (and much more) can be found in: M. Bernal-Escobar. 2024. Evaluating Tree Growth Rates with Dendrochronology Throughout the 20th Century: Effects of Climate and Anthropogenic Disturbances. PhD Dissertation, University of Miami.
Glossary
(in order of use in the text)
-
Cypress domes look circular from above. Some cypress domes have an open area in the center, where the water is too deep even for bald cypress. In cypress domes, the tallest trees grow in the center (that is, in the deepest water). Cypress domes and cypress strands (see below) are typically flooded for about 250–300 days per year. Deeper, central areas of these cypress communities can stay wet throughout the year and provide vital habitat for fish, alligators, and other wildlife during low-water periods (Duever et al. 1986).
-
Cypress strands are similar to cypress domes, but a strand is an elongated or linear feature. Cypress strands are usually much larger than domes. Cypress strands and domes (see above) are typically flooded for about 250–300 days per year. Central areas of cypress strands can remain wet the entire year, providing important habitat for fish and wildlife when water dries up elsewhere (Duever et al. 1986).
-
Cypress prairies are seasonally flooded (for about 50–150 days per year), graminoid-dominated stands of dwarfed pond cypress (Duever et al. 1986, Muss 2003). Cypress prairies represent about 25% of the Preserve’s area (Muss 2003). Graminoids are grasses and grass-like plants.
-
Vapor pressure deficit is the difference between the amount of moisture in the air and the amount of moisture the air can hold when it is saturated.
-
Cross-dating is a technique in which individual growth rings from a tree are assigned to calendar years in which they were formed. Cross-dating is done by matching patterns of tree rings (patterns of wide and narrow rings) in cores from multiple trees, living or dead, in an area.
-
A chronology is a site-level representation of the average tree growth constructed from at least 20 different trees by means of cross-dating.
References
Anderson, W. T., L. S. L. Sternberg, M. C. Pinzon, T. Gann-Troxler, D. L. Childers, and M. Duever. 2005. Carbon isotopic composition of cypress trees from South Florida and changing hydrologic conditions. Dendrochronologia 23:1–10.
Bernal-Escobar, M., C. L. Angelo, and K. Feeley. 2025. A Dendrochronological Assessment of Growth Rates in Three Dominant Tree Species of the Big Cypress National Preserve (Florida, USA). Report to National Park Service, Big Cypress National Preserve. Note: The report is in preparation and a link will be provided here soon.
Duever, M. J., J. E. Carlson, J. F. Meeder, L. C. Duever, L. H. Gunderson, L. A. Riopelle, T. R. Alexander, R. L. Myers, and D. P. Spangler. 1986. The Big Cypress National Preserve. National Audubon Society, New York, NY, USA. Research Report No. 8.
Foster, T. E., and J. R. Brooks. 2001. Long-term trends in growth of Pinus palustris and Pinus elliottii along a hydrological gradient in central Florida. Canadian Journal of Forest Research 31(10):1661–1670. Available at: https://cdnsciencepub.com/doi/10.1139/x01-100.
Harley, G.L., H.D. Grissino-Mayer, and S.P. Horn. 2011. The dendrochronology of Pinus elliottii in the Lower Florida Keys: Chronology development and climate response. Tree-Ring Research 67(1). DOI: 10.3959/2010-3.1.
Harley, G., J. Maxwell, and G. Raber. 2015. Elevation promotes long-term survival of Pinus elliottii var. densa, a foundation species of the endangered pine rockland ecosystem in the Florida Keys. Endangered Species Research 29(2):117–130. Available at https://doi.org/10.3354/esr00707.
Locosselli, G. M., R. J. W. Brienen, M. D. S. Leite, M. Gloor, S. Krottenthaler, A. A. D. Oliveira, J. Barichivich, D. Anhuf, G. Ceccantini, J. Schöngart, and M. Buckeridge. 2020. Global tree-ring analysis reveals rapid decrease in tropical tree longevity with temperature. Proceedings of the National Academy of Sciences 117(52):33358–33364. Available at: https://doi.org/10.1073/pnas.2003873117.
Muss, J. D., D. F. Austin, and J. R. Snyder. 2003. Journal of the Torrey Botanical Society 130(2):119–142.
PRISM Climate Group, Oregon State University. 2023. Data created 2 November 2023 and accessed [by Bernal-Escobar 2024] on 11 November 2023 [dataset]. Obtained from https://prism.oregonstate.edu.
Speer, J. H. 2010. Fundamentals of tree-ring research. The University of Arizona Press.
Telis, P. A. 2006. The Everglades Depth Estimation Network (EDEN) for support of ecological and biological assessments. Fact sheet 2006-3087. Prepared as part of the Comprehensive Everglades Restoration Plan and the Greater Everglades Priority Ecosystems Science. Available at: https://doi.org/10.3133/fs20063087.
