Last updated: May 30, 2024
Article
Climate and Water Monitoring at Fort Bowie National Historic Site: Water Year 2022

NPS
Overview
Together, climate and hydrology shape ecosystems and the services they provide, particularly in arid and semi-arid ecosystems. Understanding changes in climate, groundwater, and surface water is key to assessing the condition of park natural resources—and often, cultural resources.
At Fort Bowie National Historic Site (Figure 1), Sonoran Desert Network scientists study how ecosystems may be changing by taking measurements of key resources, or “vital signs,” year after year—much as a doctor keeps track of a patient’s vital signs. This long-term ecological monitoring provides early warning of potential problems, allowing managers to mitigate them before they become worse. At Fort Bowie National Historic Site, we monitor climate, groundwater, and springs, among other vital signs.
Surface-water and groundwater conditions are closely related to climate conditions. Because they are better understood together, we report on climate in conjunction with water resources. Reporting is by water year (WY), which begins in October of the previous calendar year and goes through September of the water year (e.g., WY2022 runs from October 2021 through September 2022).
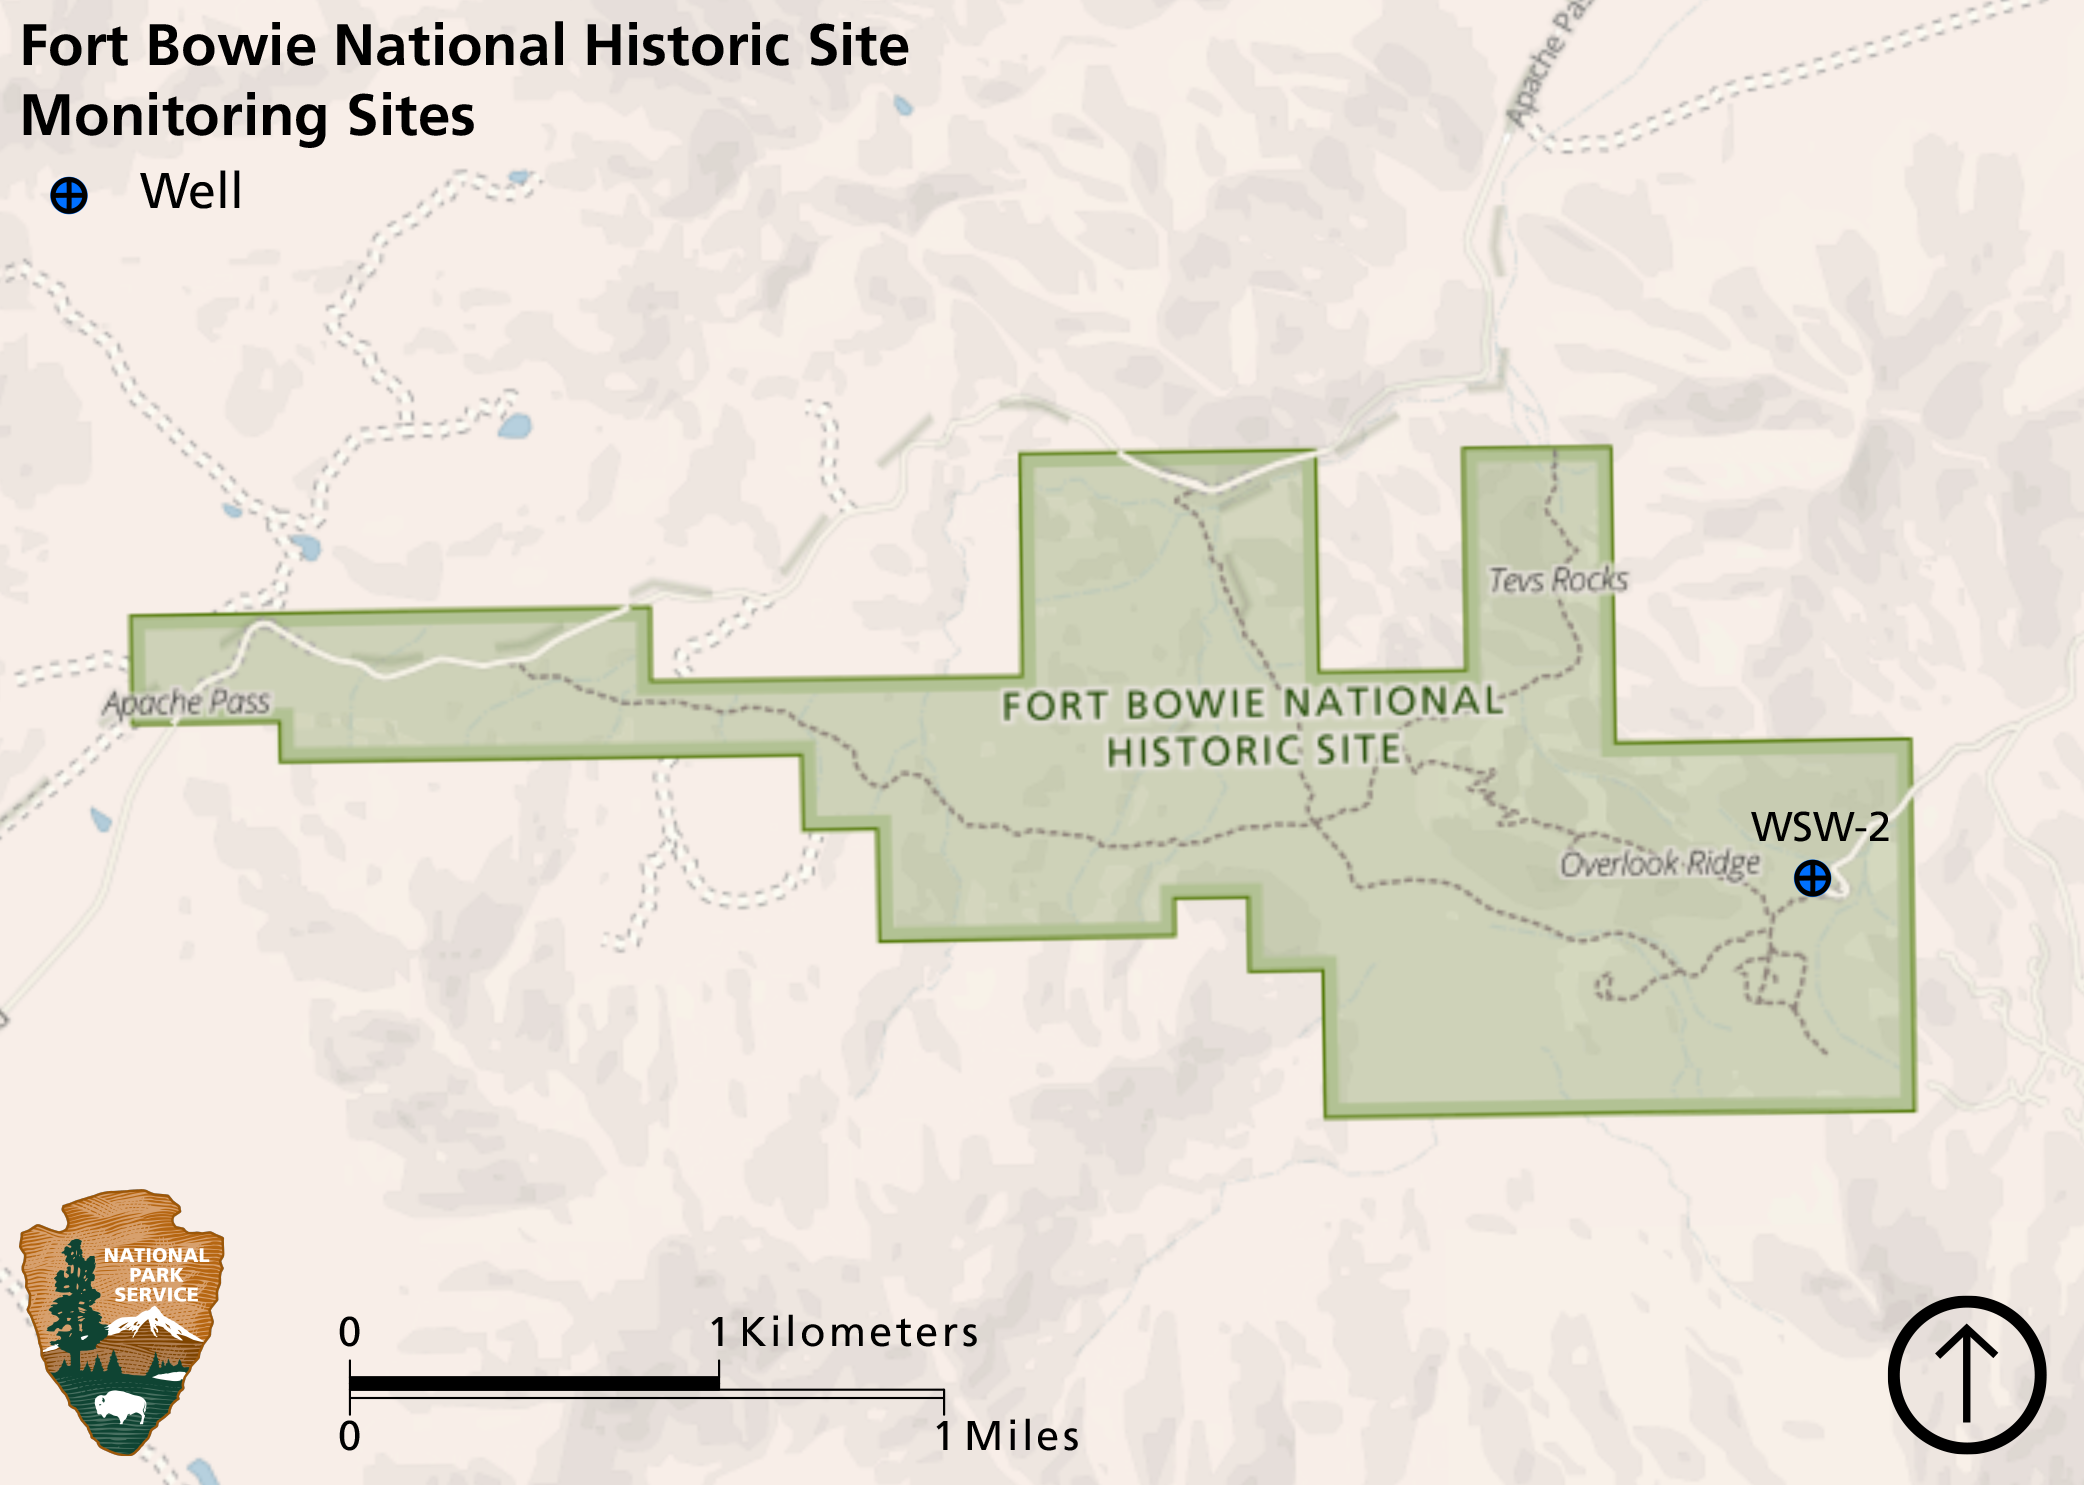
This article reports the results of climate and water monitoring at Fort Bowie National Historic Site (Figure 1) in WY2022.
NPS
Climate and Weather
There is often confusion over the terms “weather” and “climate.” In short, weather describes instantaneous meteorological conditions (e.g., it’s currently raining or snowing, it’s a hot or frigid day). Climate reflects patterns of weather at a given place over longer periods of time (seasons to years). Climate is the primary driver of ecological processes on earth. Climate and weather information provide context for understanding the status or condition of other park resources.
Methods
The closest long-term weather station to Fort Bowie National Historic Site is 10.5 mi (16.8 km) away at Chiricahua National Monument, where the climate is not representative of Fort Bowie National Historic Site due to drastic differences in topography. As a substitute, climate analyses in this year’s report use current year and 30-year averages (1991–2020) of gridded surface meteorological (GRIDMET) data from the location of the Fort Bowie National Historic Site visitor center.
GRIDMET is a spatial climate dataset (4 km resolution) that is interpolated using weather-station data, topography, and other observational and modeled land-surface data. Temperature and precipitation estimated from GRIDMET may vary from actual weather at a particular location, depending on the availability of weather station data and the difference in elevation between the location and that assigned to a grid cell. Data from GRIDMET are accessible through Climate Analyzer.

NPS
Results for Water Year 2022
Precipitation
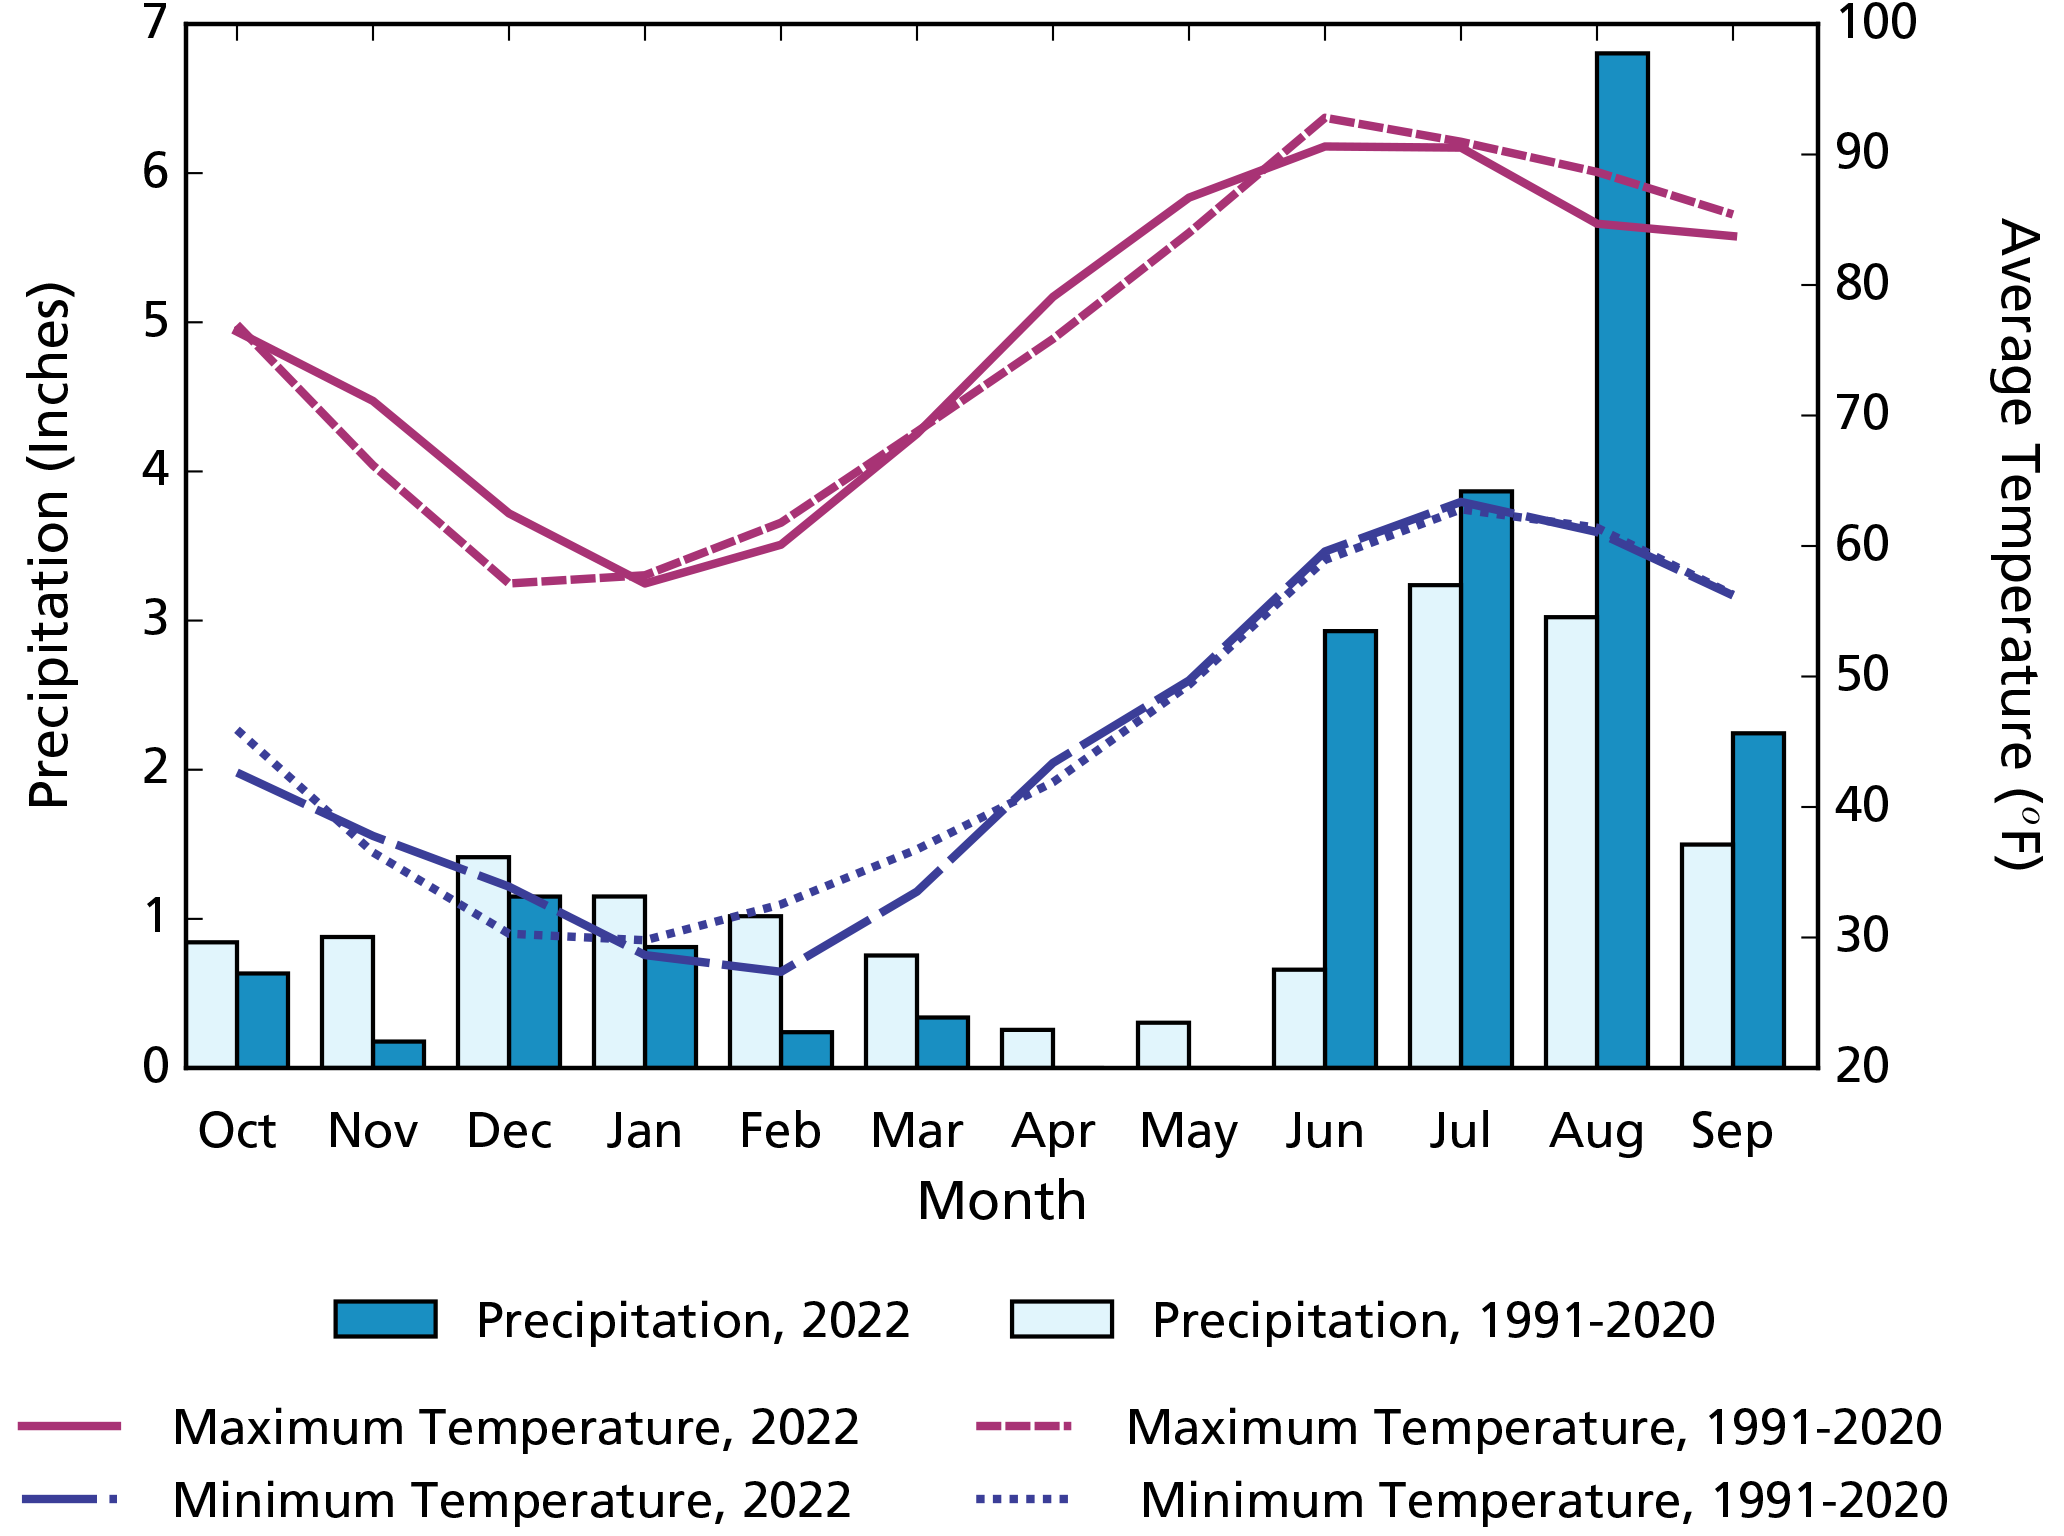
Annual precipitation at Fort Bowie National Historic Site in WY2022 was 19.19″ (48.7 cm; Figure 2), which was 4.16″ (10.6 cm) more than the 1991–2020 annual average. This surplus occurred during the monsoon season (June–September) when precipitation totaled 15.84″ (40.23 cm), 88% more than the 1991–2020 average for those months. Precipitation during all other months was less than the 1991–2020 monthly averages.
Air Temperature
The mean annual maximum air temperature at Fort Bowie National Historic Site in WY2022 was 76.0°F (24.5°C), 0.4°F (0.2°C) above the 1991–2020 average. The mean annual minimum temperature in WY2022 was 44.9°F (7.1°C), 0.4°F (0.2°C) below the 1991–2020 average. Mean monthly maximum and minimum temperatures in WY2022 differed from the 1991–2020 monthly averages by as much as 5.4°F (3.0°C; see December as an example; Figure 2). Temperatures in October, January, February, and March were cooler than the 1991–2020 monthly averages; whereas November, December, April, and May were warmer than average. From June–September, mean monthly minimum temperatures were near average, while the mean maximum monthly temperatures were cooler than average, likely because of above average monsoonal storm activity.
NPS
Drought
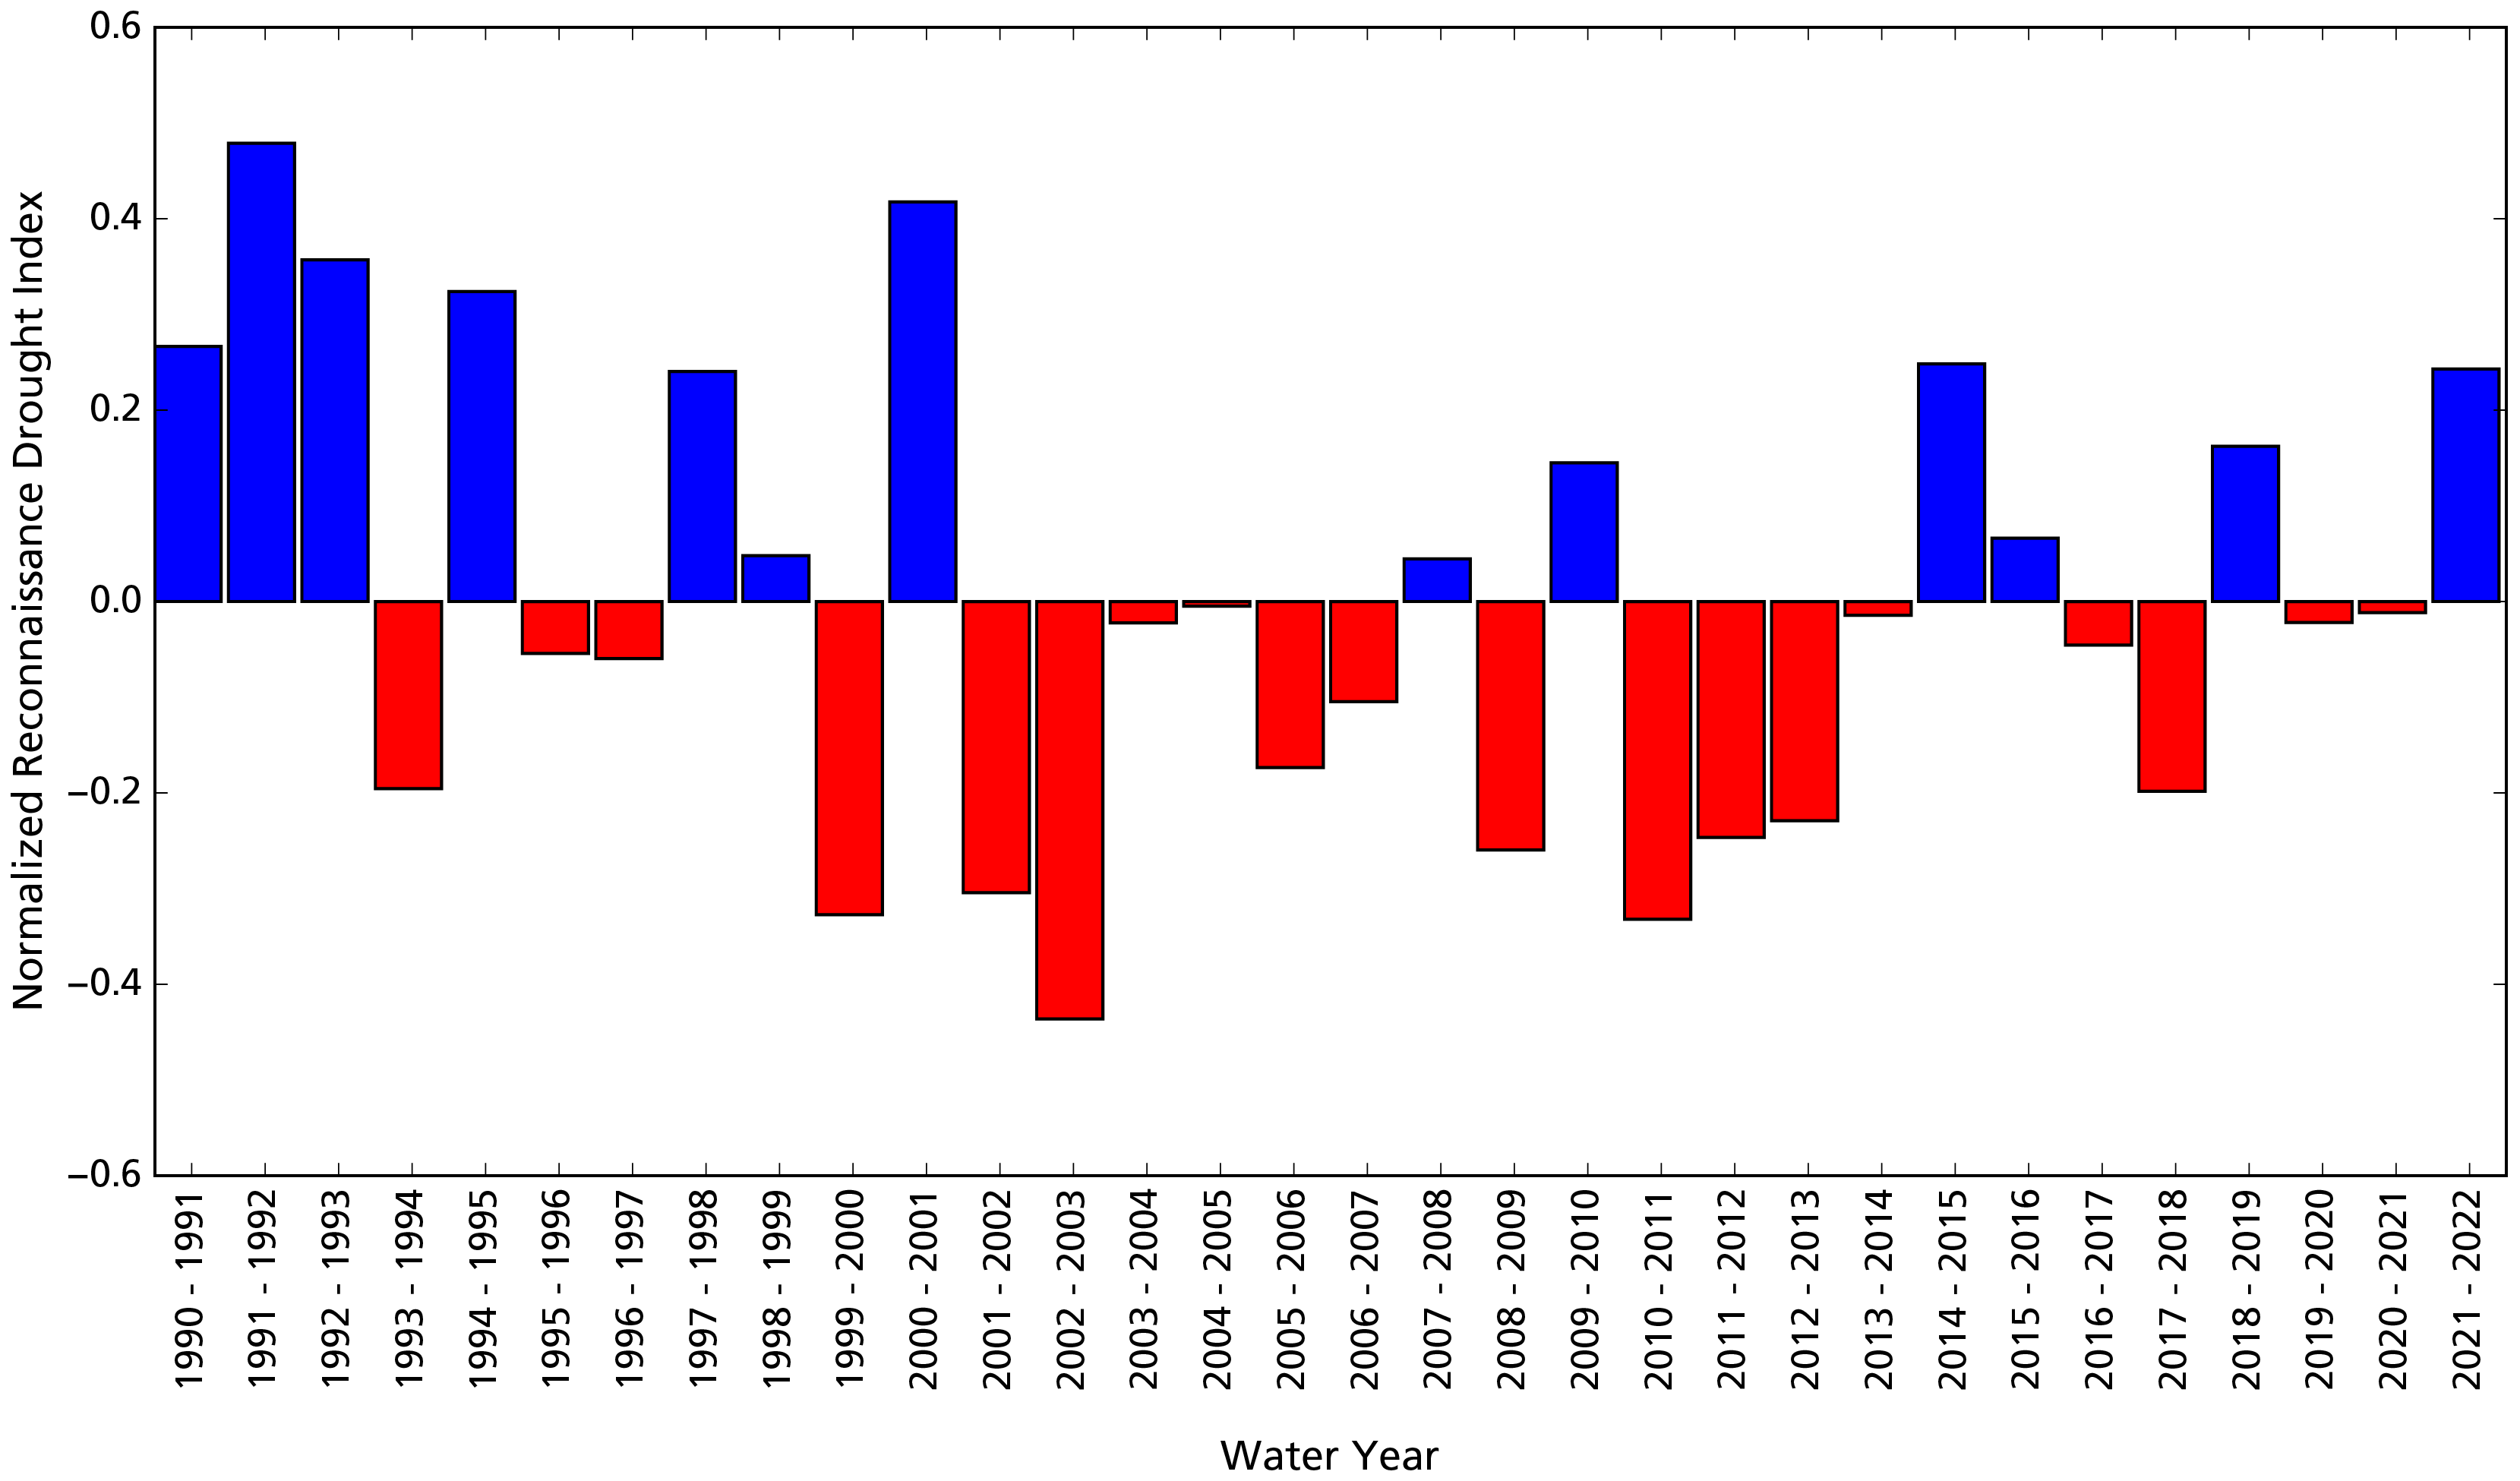
Reconnaissance drought index (Tsakiris and Vangelis 2005) provides a measure of drought severity and extent relative to the long-term climate. It is based on the ratio of average precipitation to average potential evapotranspiration (the amount of water loss that would occur from evaporation and plant transpiration if the water supply was unlimited) over short periods of time (seasons to years). The reconnaissance drought index for Fort Bowie National Historic Site indicates that WY2022 was wetter than the 1991–2022 average from the perspective of both precipitation and potential evapotranspiration (Figure 3).
Reference: Tsakiris G., and H. Vangelis. 2005. Establishing a drought index incorporating evapotranspiration. European Water 9: 3–11.
NPS
Groundwater
Groundwater is one of the most critical natural resources of the American Southwest, providing drinking water, irrigating crops, and sustaining rivers, streams, and springs throughout the region.
Methods
Fort Bowie National Historic Site groundwater is monitored at one well, WSW-2 (Figure 1). Park staff manually monitor the well four to 12 times a year.
Recent Findings
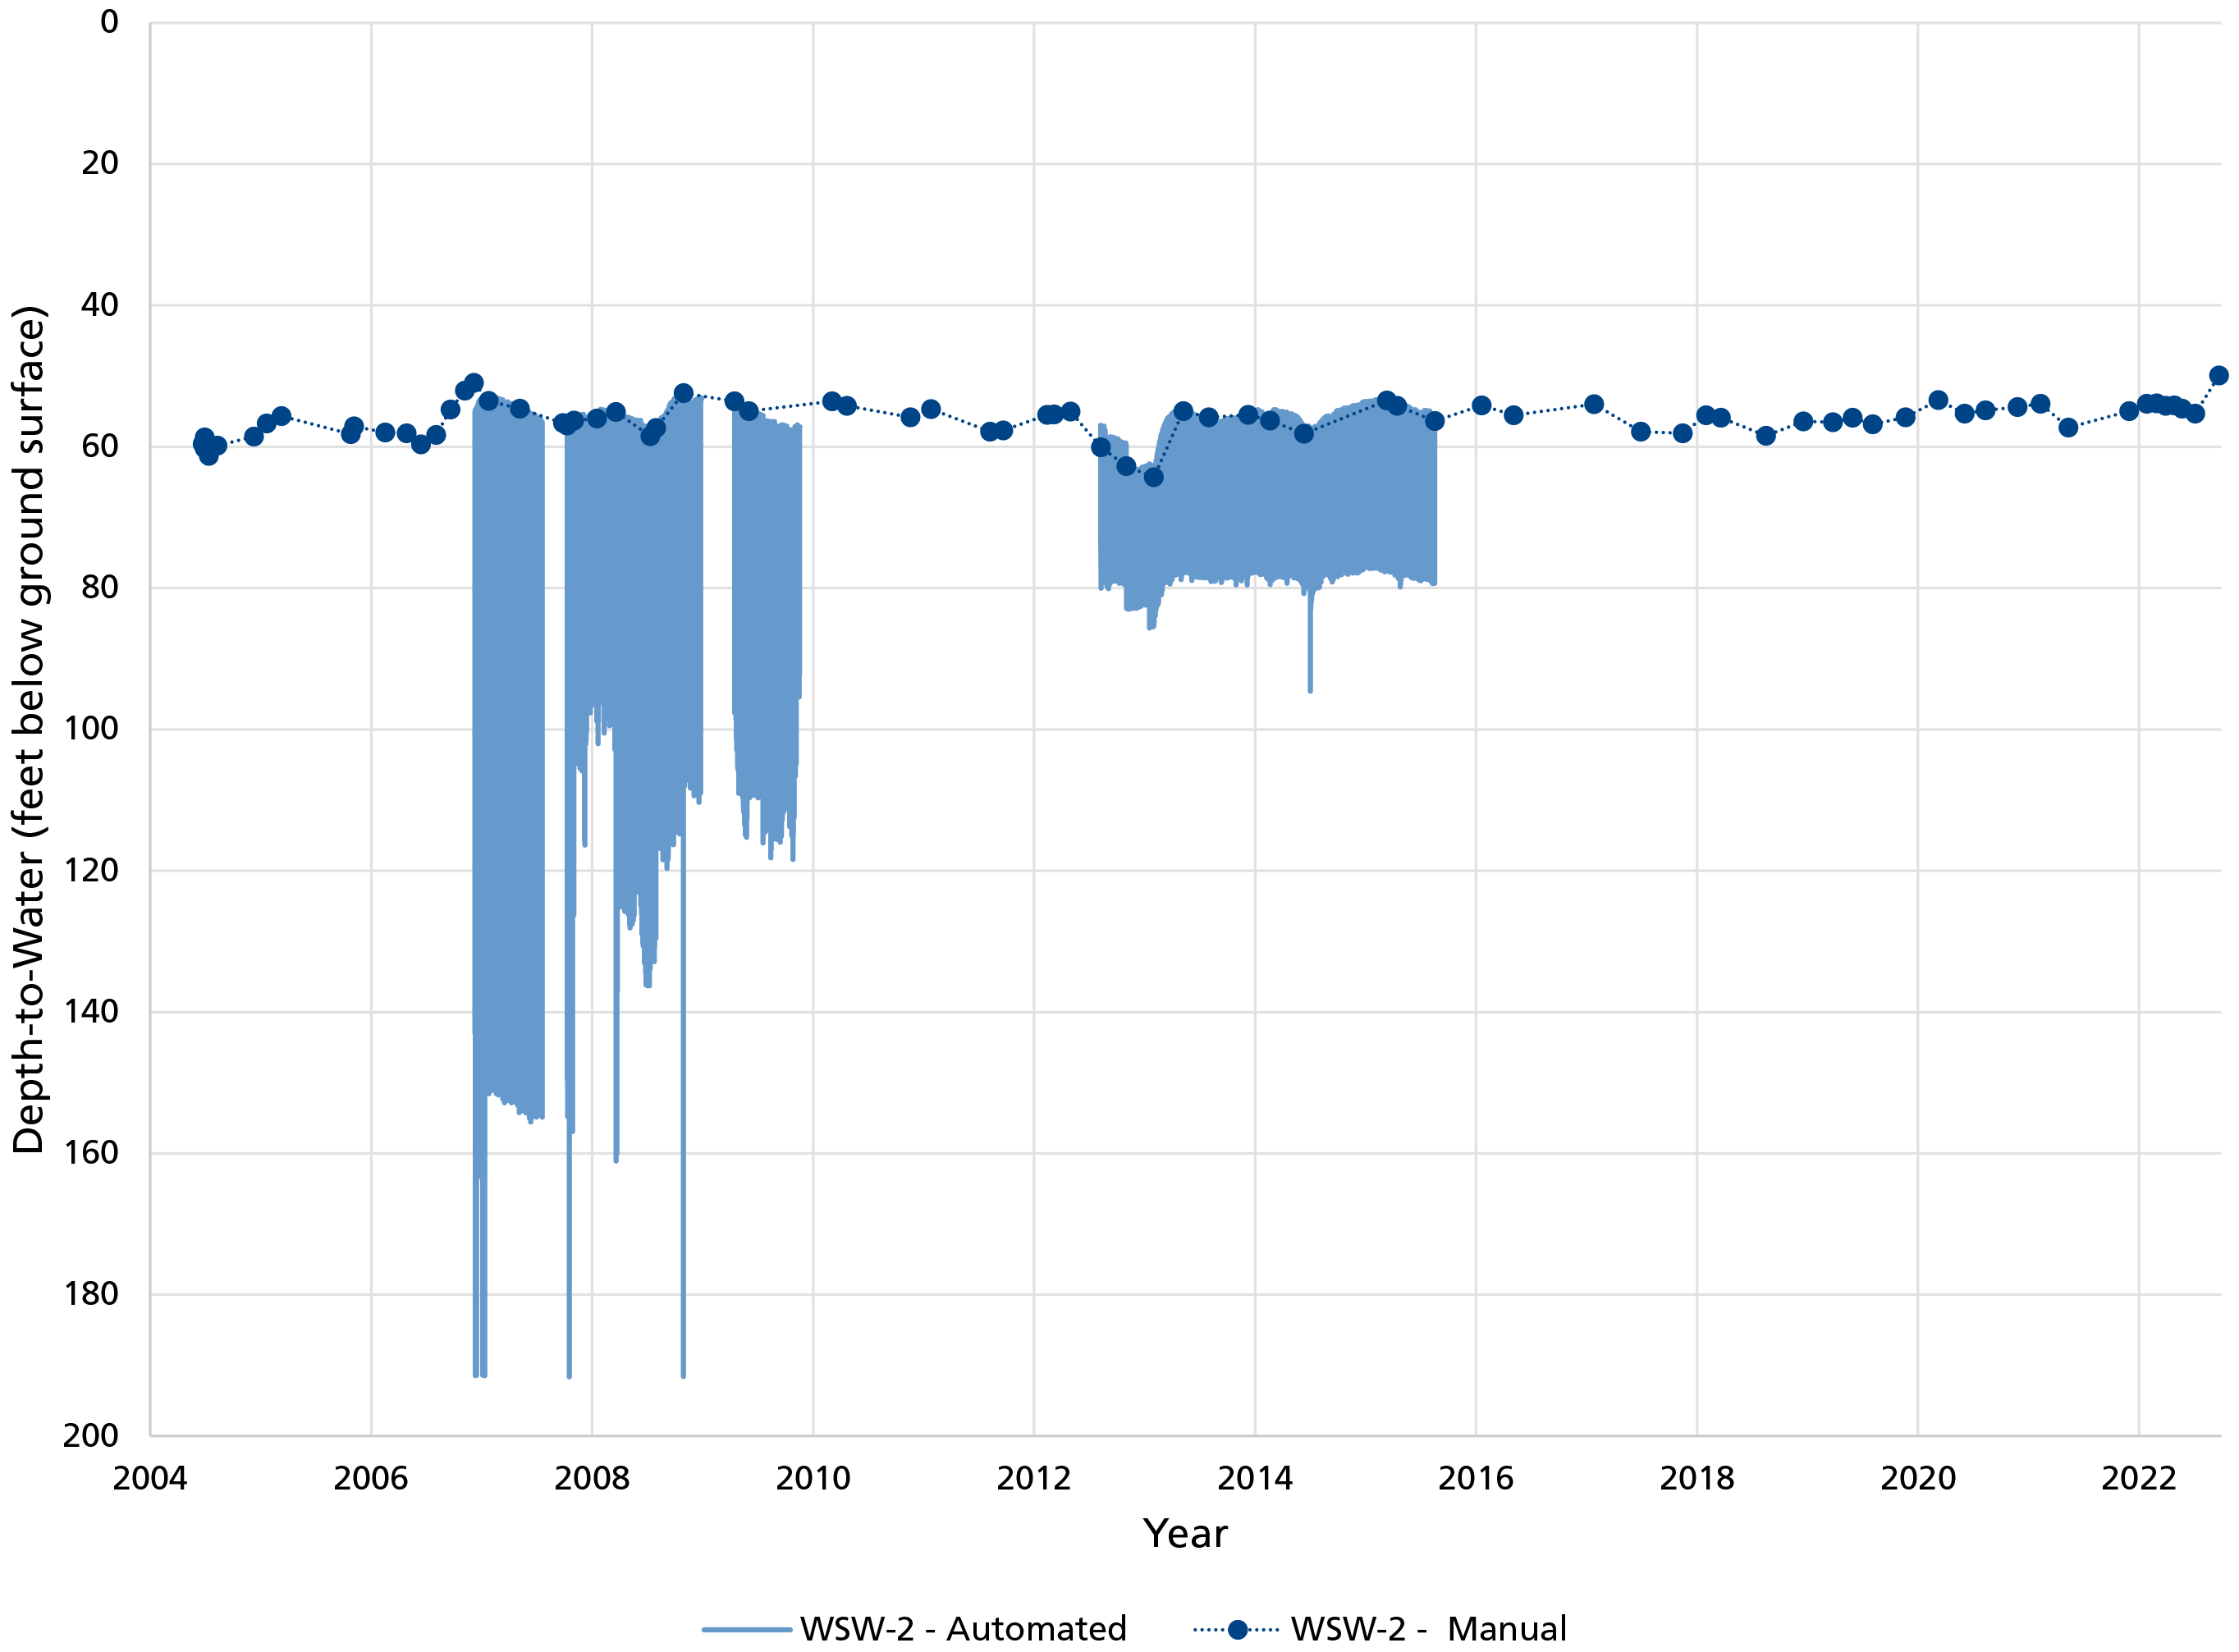
Water level at well WSW-2 was measured nine times in WY2022. Average depth-to-water was 53.86 ft (16.41 m) below ground surface (bgs), 1.33″ (3.38 cm) higher than in WY2021 (Figure 4, Table 1). The measurement collected on 22 September 2022 was 49.91 ft bgs (15.21 m bgs), which was the highest recorded water level in the monitoring period. The above-average monsoon rains in WY2022 likely contributed to this record high. Over the monitoring record the static water level has been relatively stable, ranging from 49.91 to 64.33 ft bgs (15.21 to 19.61 m bgs). Prior to 2010, WSW-2 was the park’s water supply, and groundwater pumping to support park operations caused temporary drawdowns of 42 to 138 ft (13 to 42 m), after which water levels quickly rebounded. The current water supply well, WSW-3, is located 46 ft (14 m) from well WSW-2. When well WSW-3 is being pumped to support parks operations, the drawdown observed in well WSW-2 is typically about 23 ft (about 7 m).
| Well Name | State Well Number | Wellhead Elevation (ft amsl) |
Average Depth to Water (ft bgs) |
Average Water Elevation (ft amsl) |
Elevation Change From WY2021 (ft) |
Elevation Change From Earliest Recorded Water Level ( ft) (WY) |
|---|---|---|---|---|---|---|
| WSW-2 | 582902 | 4601.75 | 53.86 | 4547.89 | 1.33 | 5.71 (2004) |
NPS
Springs
Background
Springs, seeps, and tinajas (discrete pools in a rock basin or impoundments in bedrock) are small, relatively rare biodiversity hotspots in arid lands. They are the primary connection between groundwater and surface water and are important water sources for plants and animals. For springs, the most important questions we ask are about persistence (How long was there water in the spring?) and water quantity (How much water was in the spring?).
Methods
Sonoran Desert Network springs monitoring is organized into four modules, described below.
Site Characterization
This module, which includes recording GPS locations and drawing a site diagram, provides context for interpreting change in the other modules. We also describe the spring type (e.g., helocrene, limnocrene, rheocrene, or tinaja) and its associated vegetation. Helocrene springs emerge as low-gradient wetlands, limnocrene springs emerge as pools, and rheocrene springs emerge as flowing streams. This module is completed once every five years or after significant events.
Site Condition
We estimate natural and anthropogenic disturbances and the level of stress on vegetation and soils on a scale of 1 to 4, where 1 = undisturbed, 2 = slightly disturbed, 3 = moderately disturbed, and 4 = highly disturbed. Types of natural disturbances can include flooding, drying, fire, wildlife impacts, windthrow of trees and shrubs, beaver activity, and insect infestations. Anthropogenic disturbances can include roads, off-highway vehicle trails, hiking trails, livestock and feral-animal impacts, removal of invasive non-native plants, flow modification, and evidence of human use of the spring. We take repeat photographs showing the spring and its landscape context. We note the presence of certain obligate wetland plants (plants that almost always occur only in wetlands), facultative wetland plants (plants that usually occur in wetlands, but also occur in other habitats), and non-native bullfrogs and crayfish, and we record the density of invasive, non-native plants.
Water Quantity
We measure the persistence of surface water, amount of spring discharge, and wetted extent (area that contained water). To estimate persistence, we analyze the variance of temperature measurements taken by logging thermometers placed at or near the orifice (spring opening). Because water mediates variation in diurnal temperatures, data from a submerged sensor will show less daily variation than data from an exposed open-air sensor; this tells us when the spring was wet or dry. Surface discharge is measured with a timed sample of water volume. Wetted extent is a systematic measurement of the physical length (up to 100 m), width, and depth of surface water. It is assessed using a technique for either standing water (e.g., limnocrene and helocrene springs) or flowing water (e.g., rheocrene springs).
Water Quality
We measure core water quality parameters and water chemistry. Core parameters include water temperature, pH, specific conductivity (a measure of dissolved compounds and contaminants), dissolved oxygen (how much oxygen is present in the water), and total dissolved solids (an indicator of potentially undesirable compounds). Discrete samples of these parameters are collected with a multiparameter meter. If the meter failed calibration check(s), we indicate that condition when presenting data. Water chemistry is assessed by collecting surface water samples and estimating the concentration of major ions with a photometer in the field. These parameters are collected at one or more sampling locations within a spring. Data are presented only for the primary sampling location. Each perennial spring is somewhat unique, and there are not water quality standards specific to most perennial springs in Arizona. Where conditions exceed water quality standards for other surface waters (rivers, streams, lakes, and reservoirs), we note it, but the reader is advised that these standards were not developed for perennial springs. Our ongoing data collection at each spring will improve our understanding of the natural range in water quality and water chemistry parameters for a given site.
eDNA
An inventory of rare and invasive species and pathogens in perennial springs was implemented in WY2022 using environmental DNA (eDNA) techniques. Samples were preserved in ethanol prior to DNA extraction and analysis by the Goldberg Lab at Washington State University.
Target Organisms for eDNA Project:
- The non-native invasive American bullfrog (Rana catesbeiana), which had been reported previously at Fort Bowie National Historic Site and may still be present (Powell et al. 2006).
- The pathogen chytrid fungus (Batrachochytrium dendrobatidis), a major threat to amphibians globally that is currently expanding in the American Southwest. Chytrid has not been previously detected at Fort Bowie National Historic Site.
- Ranaviruses, pathogens that can infect amphibians and produce 90–100% mortality in tadpoles and adults and can persist in affected wetlands. Ranaviruses have not been previously detected at Fort Bowie National Historic Site.
- The native amphibian Chiricahua leopard frog (Rana chiricahuensis), a federally designated threatened species. This species has a historical range that included Fort Bowie National Historic Site, and it was documented on site as recently as 2001 (Powell et al. 2006). Designated critical habitat is located south in the Chiricahua Mountains.
- The native amphibian lowland leopard frog (Rana yavapaiensis), a species of conservation concern that occurs in the region but has not been observed within Fort Bowie National Historic Site (Powell et al. 2006).
- The native aquatic snake northern Mexican garter snake (Thamnophis eques megalops), a federally designated threatened species that has not been previously observed within the Fort Bowie National Historic Site (Powell et al. 2006). Designated critical habitat is found well south of the park at San Bernardino National Wildlife Refuge.
- The native mammal jaguar (Panthera onca), a federally designated endangered species that was historically found within Fort Bowie National Historic Site. The park lies within the designated critical habitat for jaguar recovery.
Reference: Powell, B.F., Schmidt, C.A., Halvorson, W.L., and Anning, Pamela., 2006. Vascular plant and vertebrate inventory of Fort Bowie National Historic Site. U.S. Geological Survey Open-File Report Report 2005-1167. USGS Southwest Biological Science Center, Sonoran Desert Research Station, University of Arizona. Tucson, AZ.
Scroll down or click on a spring below to view monitoring results.
Apache SpringLower Mine Tunnel Seep

NPS
Recent Findings at Apache Spring
Apache Spring is a rheochrene spring (emerges as a flowing stream) in upper Siphon Canyon (Figure 5). Apache Spring consists of multiple orifices occurring along the drainage, with the primary orifice influenced by a springbox and rock retaining wall (Figure 6). These orifices support a springbrook and a variety of riparian trees, shrubs, and herbaceous plants. Apache Spring is an important water source in the area and was a major reason for the establishment of Fort Bowie.
NPS
Apache Spring was last characterized during the WY2022 visit, which occurred on 13 April 2022. The spring contained water during the visit. Descriptions and other characteristics of springs are updated every five years.
Site Condition
Consistent with past years we rated Apache Spring as “highly disturbed” from flow modification (the springbox and retaining wall), “moderately disturbed” from hiking trails (the main monument trail goes directly to the spring) and “slightly disturbed” from wildlife use (tracks and evidence of grazing and browsing in and around the springbrook). No other natural or human-caused disturbances were observed at Apache Spring in WY2022.
As in all previous years, we did not detect crayfish or bullfrogs (non-native invasive aquatic animals), nor did we detect any non-native plants. We also did not detect any obligate or facultative wetland plants, although the surrounding Siphon Canyon drainage contains substantial riparian vegetation.
Four water samples were collected and filtered (0.45 µm mesh) from the springbrook and pools at Apache Spring on 13 April 2022 to analyze eDNA. None of our target organisms were detected. Data collection for eDNA continues at this site, and additional information will be provided in a future, more detailed report.
Water Quantity
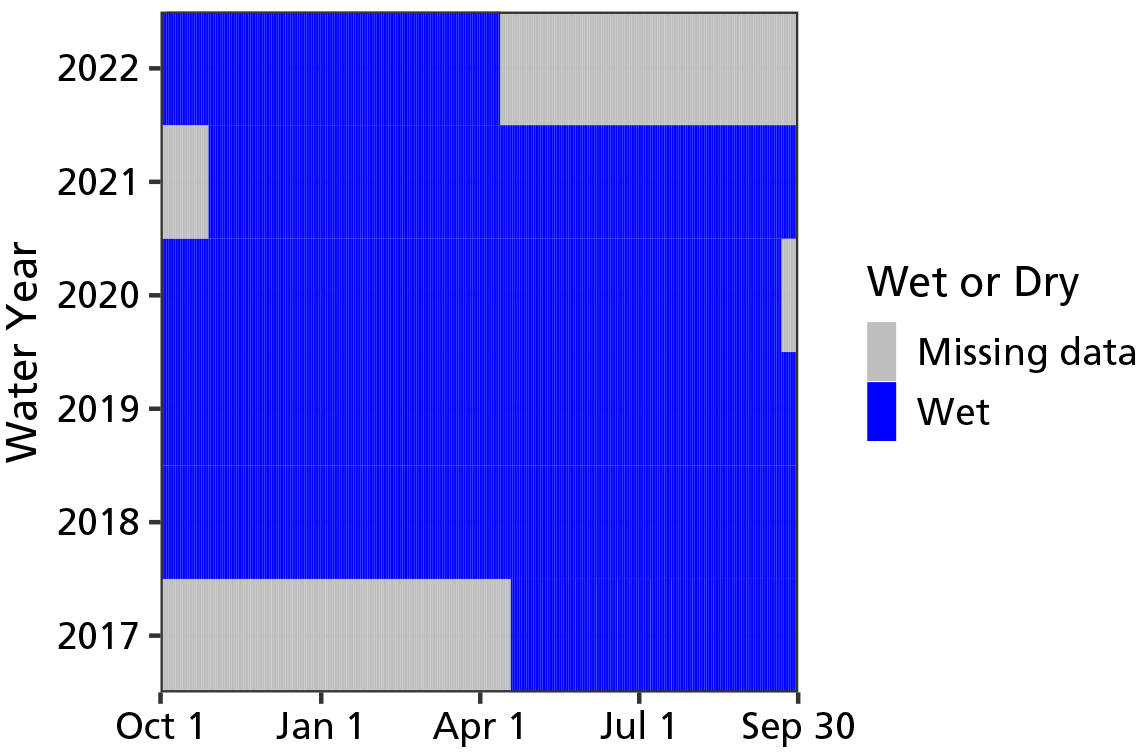
The WY2022 visit occurred on 13 April 2022, and the spring contained water. Temperature sensors indicated that Apache was ‘wetted’ (contained water) for all 195 days (100%) measured up to the WY2022 visit (Figure 7). In prior water years, the spring was wetted 100% of the days measured.
NPS
Discharge was estimated at 6.4 (± 0.4) L/min (1.7 ± 0.1 gal/min) in WY2022, which was on the lower end of the range of previous measurements at Apache Spring (Table 2).
Wetted extent was evaluated using a method for flowing water at Apache Spring in WY2022. The total brook length was 54 m (177 ft). Width and depth averaged 77.7 cm (30.6 in), and 2.1 cm (0.8 in), respectively—all extent measures were within the range observed in previous years (Table 3).
Water Quality
Core water quality and water chemistry data were collected at the primary sampling location in Apache Spring in WY2022. The water quality probe contacted the sediment due to the shallow water, which may have influenced our results. Specific conductivity, total dissolved solids, and magnesium were slightly lower and potassium slightly higher than previously observed at Apache Spring (Tables 4 and 5). All other parameters were within the range observed in prior years (Tables 4 and 5).
Apache Spring Data Tables
Sampling Location |
WY2022 Value (L/min) (range of prior values) |
Prior Years Measured (# of measurements) |
|---|---|---|
| 002 | 6.4 ± 0.4 (8–16.9) | 2017–2021 (4) |
| Measurement | WY2022 Value (range of prior values) |
Prior Years Measured (# of measurements) |
|---|---|---|
| Width (cm) | 77.7 ± 44.5 (75.9–93.3) | 2017–2021 (4) |
| Depth (cm) | 2.1 ± 0.6 (1.2–2.2) | 2017–2021 (4) |
| Length (m) | 53.6 (50.4–58.5) | 2017–2021 (4) |
| Sampling Location | Measurement Location (width, depth) |
Parameter | WY2022 Value (range of prior values) |
Prior Years Measured (# of measurements) |
|---|---|---|---|---|
| 001 | Center | Dissolved oxygen (mg/L) | 5.13 (5.00–6.75) | 2017–2021 (3) |
| 001 | Center | pH | 7.43 (7.29–7.42) | 2017–2021 (3) |
| 001 | Center | Specific conductivity (µS/cm) | 545 (565–624) | 2017–2021 (3) |
| 001 | Center | Temperature (°C) | 18.1 (17.2–18.2) | 2017–2021 (5) |
| 001 | Center | Total dissolved solids (mg/L) | 355 (367–403) | 2017–2021 (4) |
| Sampling Location | Measurement Location (width, depth) |
Parameter | WY2022 Value (mg/L) (range of prior values) |
Prior Years Measured (# of measurements) |
|---|---|---|---|---|
| 001 | Center | Alkalinity (CaCO3) |
230 (225–260) | 2017–2021 (4) |
| 001 | Center | Calcium (Ca) |
56 (85–105) | 2017–2021 (4) |
| 001 | Center | Chloride (Cl) |
7 (5–10) | 2017–2021 (4) |
| 001 | Center | Magnesium (Mg) |
5 (10–19) | 2017–2021 (4) |
| 001 | Center | Potassium (K) |
2.2 (0.5–1.1) | 2017–2021 (4) |
| 001 | Center | Sulphate (SO4) |
38 (29–44) | 2017–2021 (4) |

NPS
Recent Findings at Lower Mine Tunnel Spring
Lower Mine Tunnel Spring is a cave spring (emerges entirely within cave and not directly connected to surface flow). The spring emerges from a springbox (Figure 8), which divides flow between Fort Bowie National Historic Site and an adjacent landowner with a water right. The park's allocation is piped about 10 m downhill where it supports a springbrook and small (1 m x 2 m) shallow pool (Figure 9). Lower Mine Tunnel Spring contained water and supported a dense canopy of shrubs and herbaceous vegetation hen characterized during the WY2022 visit on 13 April 2022. Descriptions and other characteristics of springs are updated every five years.

NPS
Site Condition
Consistent with past years, we rated Lower Mine Tunnel Spring as “highly disturbed” from flow modification (the springbox and piping) and “slightly disturbed” from roads (the main park access road is nearby), trails (a social trail leads to the springbrook), and wildlife use (tracks, digging, and other signs throughout the springbrook). No other natural or human-caused disturbances were detected in WY2022.
Consistent with past years, in WY2022 we observed sedges (Carex and Cyperaceae sp.), obligate wetland plants, and mule-fat (Baccharis salicifolia), a facultative wetland species.
Four water samples were collected and filtered (0.45 µm mesh) from the springbrook and pools at Lower Mine Tunnel Spring on 13 April 2022 for eDNA analysis. None of our target organisms were detected. Data collection for eDNA continues at this site, and additional information will be provided in a future, more detailed report.
Water Quantity
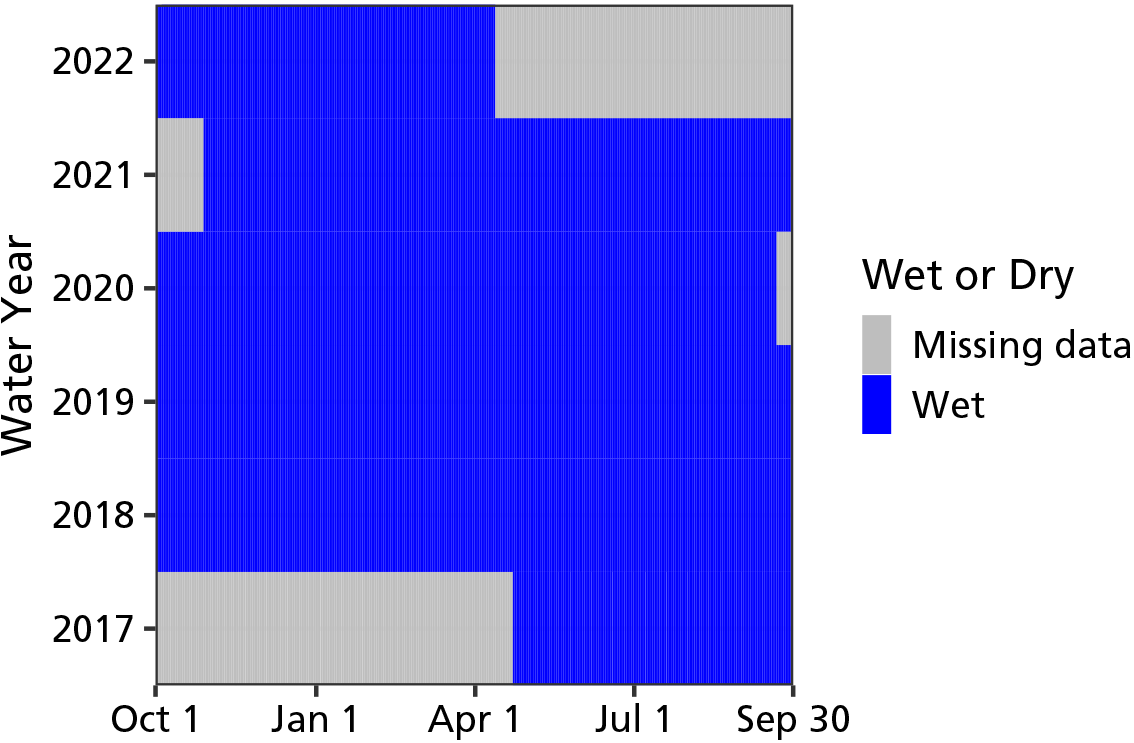
The WY2022 visit occurred on 13 April 2022, and the spring contained water. Temperature sensors indicated that Lower Mine Tunnel Spring was ‘wetted’ (contained water) for all 195 days (100%) measured up to the WY2022 visit (Figure 10). In prior water years, the spring was wetted 100% of the days measured.
NPS
Discharge was estimated at 10 (± 0.2) L/min (2.7 ± 0 gal/min) in WY2022, which is comparable with previous measurements (Table 6).
Wetted extent at Lower Mine Tunnel Spring was evaluated using a method for flowing water. The total brook length was 20 m (66 ft), and width and depth averaged 35.5 cm (14 in) and 0.9 cm (0.3 in), respectively—all within the range of extent measurements from previous years (Table 7).
Water Quality
Core water quality and water chemistry data were collected at the primary sampling location in Lower Mine Tunnel Spring in WY2022. All values were within the ranges recorded in prior years (Tables 8 and 9).
Lower Mine Tunnel Spring Data Tables
Sampling Location |
WY2022 Value (L/min) (range of prior values) |
Prior Years Measured (# of measurements) |
|---|---|---|
| 002 | 10 ± 0.2 (8.5–16.5) | 2017–2021 (3) |
| Measurement | WY2022 Value (range of prior values) |
Prior Years Measured (# of measurements) |
|---|---|---|
| Width (cm) | 35.5 ± 37.2 (38.0–85.8) | 2017–2021 (4) |
| Depth (cm) | 0.9 ± 0.9 (0.7–2.9) | 2017–2021 (4) |
| Length (m) | 20.0 (12.1–52.1) | 2017–2021 (4) |
| Sampling Location | Measurement Location (width, depth) |
Parameter | WY2022 Value (range of prior values) |
Prior Years Measured (# of measurements) |
|---|---|---|---|---|
| 001 | Center | Dissolved oxygen (mg/L) | 5.99 (5.38–6.05) | 2017–2021 (6) |
| 001 | Center | pH | 7.31 (7.20–7.40) | 2017–2021 (6) |
| 001 | Center | Specific conductivity (µS/cm) | 552 (533.4–557.0) | 2017–2021 (6) |
| 001 | Center | Temperature (°C) | 18.5 (17.8–19.4) | 2017–2021 (7) |
| 001 | Center | Total dissolved solids (mg/L) | 359.0 (346.4–357.5) | 2017–2021 (6) |
| Sampling Location | Measurement Location (width, depth) |
Parameter | WY2022 Value (mg/L) (range of prior values) |
Prior Years Measured (# of measurements) |
|---|---|---|---|---|
| 001 | Center | Alkalinity (CaCO3) |
240 (235–260) | 2017–2021 (4) |
| 001 | Center | Calcium (Ca) |
64 (65–95) | 2017–2021 (4) |
| 001 | Center | Chloride (Cl) |
13 (1–18) | 2017–2021 (4) |
| 001 | Center | Magnesium (Mg) |
9 (9–22) | 2017–2021 (4) |
| 001 | Center | Potassium (K) |
3.0 (2.3–3.2) | 2017–2021 (4) |
| 001 | Center | Sulphate (SO4) |
40 (24–41) | 2017–2021 (4) |
Article created by the Sonoran Desert Inventory and Monitoring Network.
