Part of a series of articles titled Water Resources Monitoring in the Madison River near West Yellowstone, Montana.
Article
Water Quality in the Madison River Near West Yellowstone, Montana
The Madison River has high quality water that is influenced by local geology. Many of Yellowstone National Park’s geyser basins drain into the Firehole River, which joins the Gibbon River to form the Madison River. This natural geothermal activity can contribute to raised temperature, pH, and arsenic levels that exceed state water quality criteria (Thompson 1979).
We sampled the Madison River for water chemistry and core water quality parameters eight times from April to November in 2021. Core water quality parameters include temperature, specific conductance, dissolved oxygen, pH, and turbidity.
The river contained low levels of dissolved nutrients. On all sampling dates, ammonia as nitrogen (NH3 as N) was below detection levels (reporting limit is 0.05 mg/L). Nitrate + nitrite as nitrogen (NO3 + NO2 as N) levels measured between 0.02 and 0.05 mg/L when detected or were under the detection limit (reporting limit is 0.01 mg/L). Between April and November 2021, total suspended solids (TSS) levels in the Madison River ranged from 2 to 23 mg/L (reporting limit is 1 mg/L). The highest TSS levels (23 mg/L) occurred during the 2 May sampling event and near peak runoff for the year.
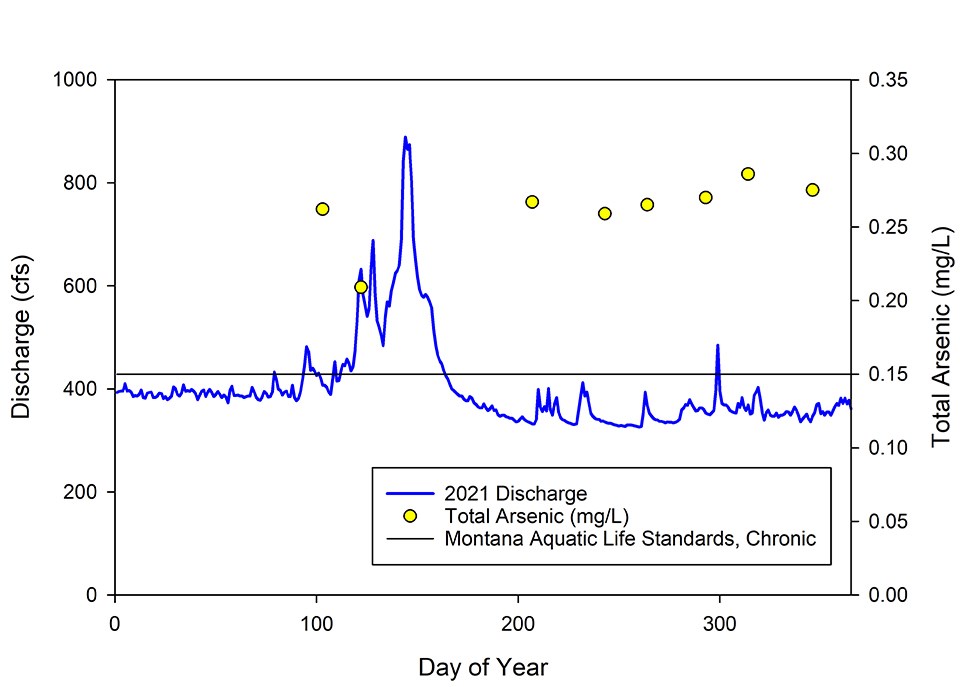
Surface water from the Madison River near West Yellowstone, MT, exceeded the State of Montana’s chronic aquatic life criteria (0.15 mg/L) for total arsenic during all sampling events. Surface water and groundwater contributing to the Madison River inside the park boundary are influenced by geothermal features (NPS 1994). Accordingly, arsenic in the Madison River is likely naturally occurring from the geothermal geology in the watershed.

NPS
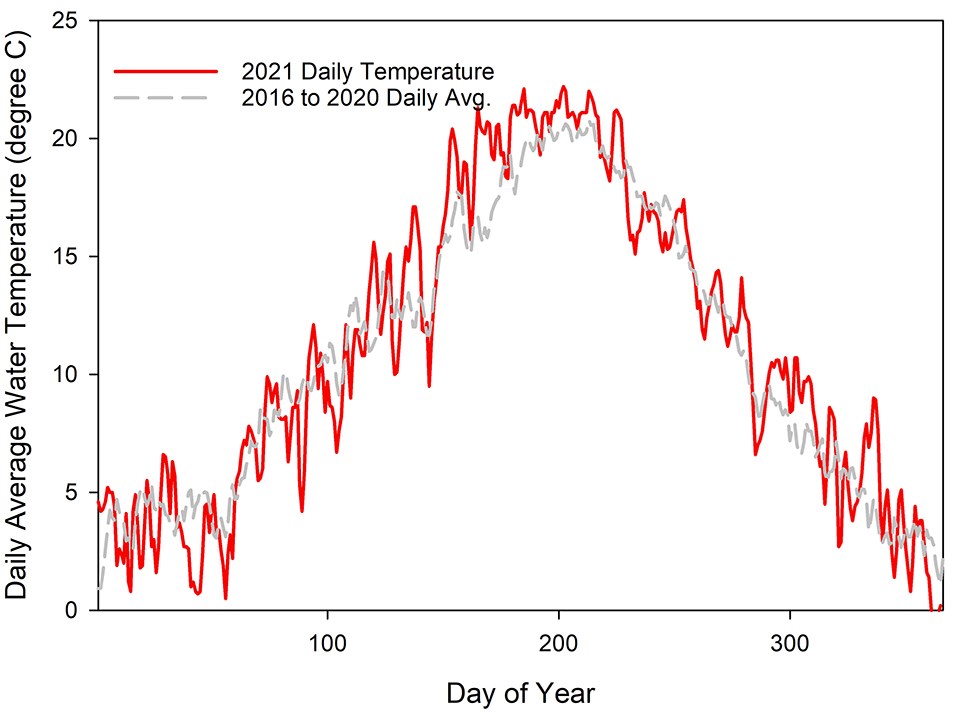
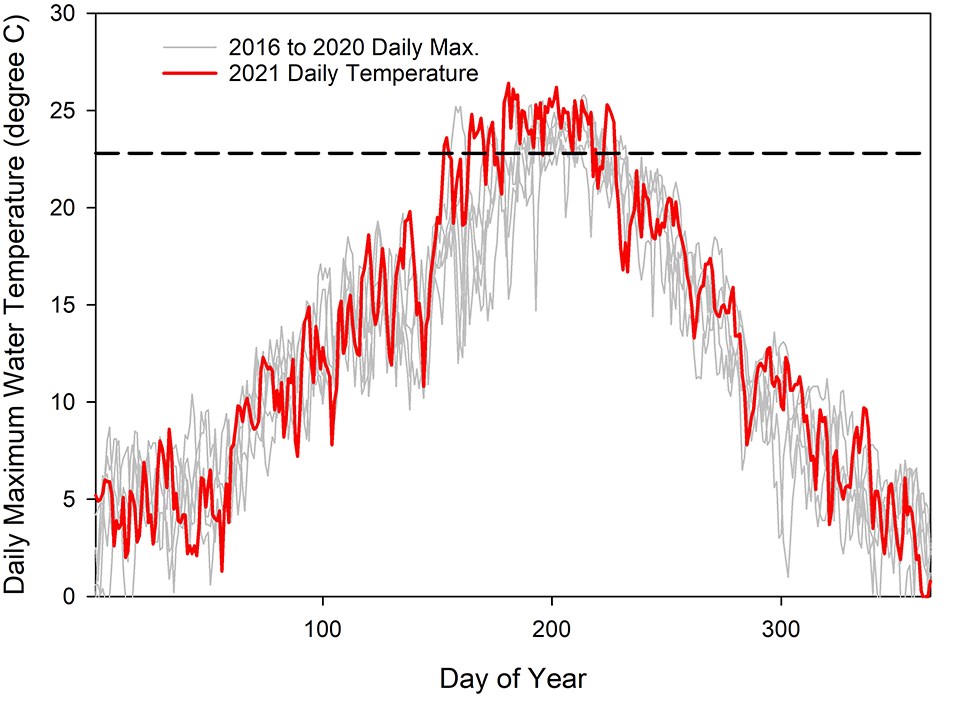
Water temperature is monitored continuously by the USGS at the Madison River near West Yellowstone, MT, station (USGS Gage 06037500). Average daily water temperatures in 2021 were higher, and warmer temperatures occurred earlier, than average daily water temperatures from the previous five years (2016–2020). In 2021, daily maximum water temperatures were above the daily maximum water temperatures from 2016 to 2020. The daily maximum water temperature reached in 2021 was 26.4°C. The average daily maximum water temperature from 2016 to 2020 was 24.3°C.
Montana Fish, Wildlife and Parks regulates cold water fishing closures when water temperatures exceed 73.0°F (22.8°C) at any time of the day for three consecutive days (Montana Rule 12.5.507). In 2021, temperatures first exceeded 22.8°C on 2 June (day 153 of the year). Temperatures were sustained above this threshold for at least three days in a row beginning on 13 July (day 164 of the year) and continuing through mid-August. Geothermal activity from Yellowstone National Park's geyser basins, which drain into Madison River headwaters, contributes to raised temperature levels above the state water quality criteria (Thompson 1979).

NPS

NPS
2021 Water Quality Lab Results
The following two tables contain water quality lab results for the Madison River near West Yellowstone, MT, from April through August and September through November, respectively. Download tabular data here for these tables.
| Water Chemistry Lab Parameters (Madison River near West Yellowstone, MT) | Reporting Limit | 13-Apr | 2-May | 26-Jul | 26-Jul Blank Sample | 31-Aug |
|---|
| Water Chemistry Lab Parameters (Madison River near West Yellowstone, MT) | Reporting Limit | 21-Sep | 21-Sep Replicate Sample | 20-Oct | 10-Nov | 12-Dec | 12-Dec Blank Sample |
|---|
| Water Quality Field Parameters (Madison River near West Yellowstone, MT) | 13-Apr | 2-May | 26-Jul | 31-Aug | 21-Sep | 20-Oct | 10-Nov | 12-Dec |
|---|
More Data
Data prior to 2021 are available at the Water Quality Portal using YELLWQ01 for the project and WQX-YELL_MDR as the site identifier for the Madison River near West Yellowstone, MT.
Last updated: March 10, 2023
