Last updated: February 9, 2022
Article
Mind the Gap: Modeling Missing Data for Complex Survey Designs
In protected areas around the world, managers need answers to a few core questions: How healthy is the park right now? Are conditions changing? If so, what might be causing these changes? In other words, they need to understand the status, trends, and drivers of the condition of natural resources they manage. This article summarizes a recently published study by Zachmann et al. (2021), Bayesian Models for Analysis of Inventory and Monitoring Data with Non-ignorable Missingness, illustrating a new and improved approach for answering these questions. The research is part of a growing exploration of Bayesian hierarchical modeling by National Park Service (NPS) scientists seeking to apply the most appropriate and useful approaches to analyzing long-term monitoring data from parks.
Sampling Design and Missing Data
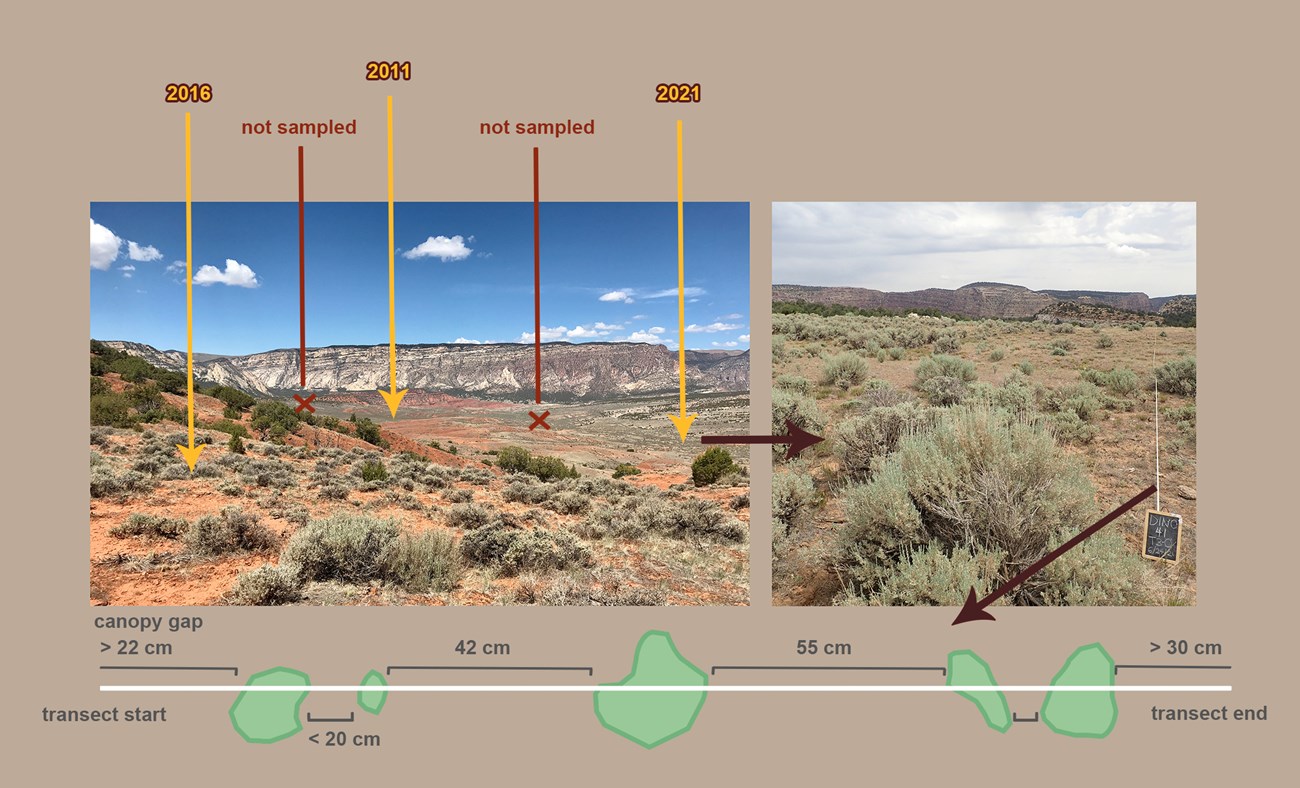
NPS scientists have been gathering long-term monitoring data about the condition of natural resources in parks since the early 2000s through the Inventory and Monitoring Division. Because park lands cover large areas and resources are limited, this information can only be gathered for a fraction of the landscape. Therefore, scientists developed relatively complex sampling designs that could translate conditions from a sample of sites into an estimate of conditions for an entire vegetation type or park. In this approach, information is missing by design: some areas of the park are never sampled, and many of the sites that are sampled are not sampled every year. In a few cases, even the data that are collected at sites are incomplete or imprecise in some way (Figure 1).

Figure 1. Hypothetical example of a landscape sampled at Dinosaur National Monument illustrating three types of data missing by design: data missing in time, data missing in space, and incomplete (censored and truncated) data. Yellow arrows indicate sampled sites. The year indicates the last time each site was visited by NPS field crews. The vast majority of the landscape is not sampled (for example, the red Xs). The transect along the bottom of the figure is one example of many types of data collected. Specifically, it shows canopy gaps, which are nonvegetated areas between the canopies of perennial plant species (circular green areas). Erosion is a concern with large or increasing canopy gap sizes. Crews do not record gaps <20 cm, creating truncated data. Additionally, the actual size of gaps at the end of transects is unknown, but recorded as at least as large as the distance between the end of the transect and the last canopy, creating censored data.
Nonignorable Missing Data
We often think of missing data as observations that are omitted by accident, but as we show above, some data are missing by design. This "missingness" cannot be ignored in the analysis for statistically defensible results. What this means in practice is that information about how the data were collected must be included in the analysis for all designs except when a very large number of samples are taken completely at random. In all other cases, the data that are missing by design are nonignorable.
Ignoring problematic missing data can have dramatic consequences. For instance, Shanahan et al. (2021) showed that imperfect detection by observers, in addition to other confounding factors, leads to substantial underestimates of the prevalence of disease in whitebark pine in the Greater Yellowstone Ecosystem.
The Bayesian approach to modeling is gaining traction in natural resources monitoring and management. In addition to its other strengths—interpretability and flexibility—it can “fill in the gaps” caused by nonignorable missing data. In statistical terms, this is called “imputation.” Though not essential to all long-term monitoring data, Bayesian modeling is an improvement over the original method of analyzing the results of these complex sampling designs. The original approach relies on the Horvitz-Thompson design-based estimator for determining the status of a resource, but such design-based estimators come with limitations. Bayesian modeling not only provides more appropriate estimates of status (for instance, by accounting for the hierarchical structure of the data—observations from plots within sites, sites within strata, and strata within parks), it can also estimate trends, and the drivers of change, in park natural resource conditions.
Covariates
Another advantage of Bayesian modeling over design-based approaches is the ability to include covariates. Covariates are used in models to help explain variability in the natural resources being monitored. They help address the question, what might be causing changes in resource condition? For instance, weather, climate, and terrain (slope and aspect) can influence park resources. Other types of covariates that affect results but are not the main target of investigation are called nuisance variables. For example, experience level likely affects how accurately an observer takes measurements. Or differences in the timing of spring green-up from year to year can affect vegetation measurements. Some of the covariates used in models correspond to factors that land managers can influence, such as fire or invasive species. Including other covariates, such as the experience level of field technicians, helps park scientists and managers avoid drawing spurious conclusions, as we will see below. Analytical approaches such as Bayesian modeling that can identify and incorporate important covariates can be extremely useful to park managers.
Case Studies
Our study (Zachmann et al. 2021) illustrated several ways that nonignorable missing data can affect accurate inference. More than a specific result, however, we sought to lay out a framework by which these nonignorable features of the data could be handled. Thus, the case studies we published, which we summarize below, are merely illustrations of how several types of nonignorable missing data commonly seen in long-term monitoring data are handled in the Bayesian framework.
Canopy Gaps at Capitol Reef National Park

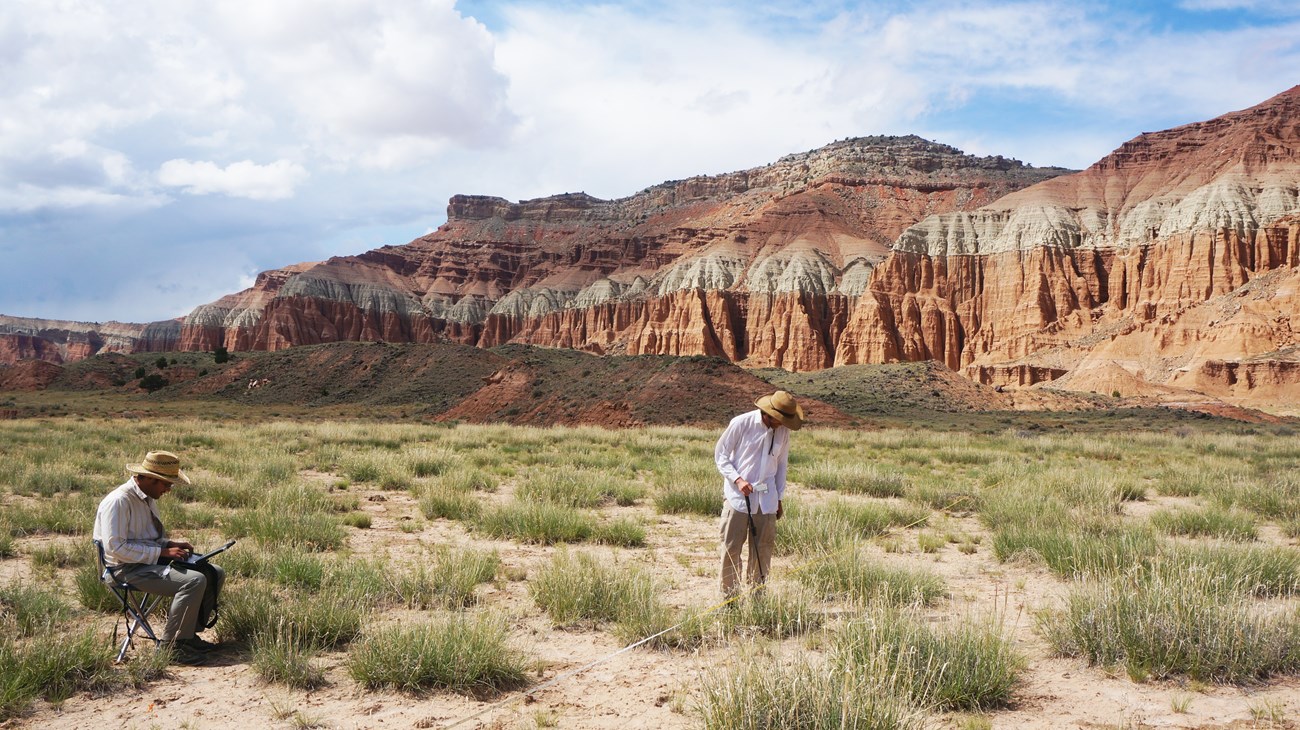
NPS/Washuta
At Capitol Reef National Park, sculptured sandstone cliffs rise above high desert bunch grasses. Long-term monitoring for upland vegetation in the park includes examining the abundance and size of canopy gaps, which indicate potential for wind erosion.
Incomplete Data
One of three types of nonignorable missing data inherent in the sampling design at Capitol Reef was incomplete data. Canopy gap data are both censored and truncated (see example canopy gap transect in Figure 1). These data are censored because gaps along a vegetation transect line that extend beyond the transect start or end points are only measured within the transect limits. We know that any gap at the end of a transect is at least as large as the distance between the transect end and the nearest canopy edge, but we do not know the true gap size. These data are also truncated because only gaps at least 20 cm long are measured. To put this another way, the canopy gap data we collect arise from artificial constraints on observations of the underlying continuous (untruncated and uncensored) distribution of gap sizes. If ignored, these missing data could lead us to an incorrect conclusion about canopy gaps.
Applying the Bayesian Model
We found that the original Horvitz-Thompson method underestimated the size range of canopy gaps because it ignored gaps <20 cm and the censoring of observations at transect end points. With the Bayesian approach, we explicitly included information about these missing small gaps and the censored observations in the model. Using imputation, the model more accurately characterized the full distribution of canopy gap sizes. Because the largest gaps are more likely to be among the censored observations, a model that ignores censoring will underestimate the proportion of large gaps, which are especially prone to erosion.
Management Applications
Clearly, this difference in model results is important for managers of arid landscapes wherever erosion is a concern. A model that underestimates the proportion of large canopy gaps might mislead managers into thinking that a landscape has less erosion potential than it actually does.
Native Plants at Little Bighorn Battlefield National Monument

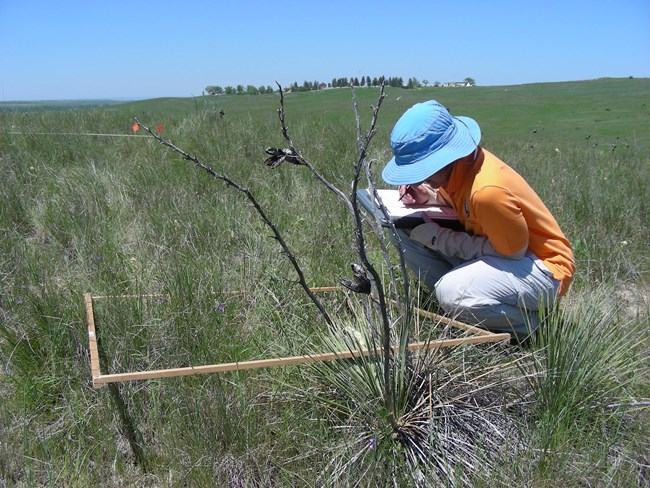
NPS/Asebrook
Little Bighorn Battlefield National Monument protects a historic cultural site set among fields of native mixed-grass prairie. This mixed-grass prairie is a dwindling resource, and NPS field crews have been monitoring the number of native species (species richness) in the monument for years as part of the long-term monitoring program.
Data Missing in Time
One of three types of nonignorable missing data in the sampling design at Little Bighorn Battlefield was data missing in time. These data were missing due to an extended revisit schedule for monitoring vegetation in the park, where only a subset of all sampled sites was visited in any given year. This is problematic because it creates missing response data (native species richness) as well as missing information about potential drivers, such as nonnative species cover.
Covariates
Two covariates—observer effect and nonnative species cover—were directly relevant to our analysis of native species richness. The original Horvitz-Thompson design-based estimates did not account for these covariates and could have led to the wrong inference about observed changes in native species richness in the park. For example, the covariate, observer, introduces a “nuisance” effect if it influences the quality of observations—thus the richness count—but is not explicitly accounted for in the model. That effect can too easily be conflated with underlying ecological processes. With the Bayesian framework, both covariates could be included in the analysis.
Applying the Bayesian Model
We found that a hierarchical model better addressed the missing data problems while simultaneously allowing us to model the effects of two covariates known to affect the data and the ecological processes involved.
Missing Data
We were able to fill the gaps in data missing in time to account for the unsampled sites each year. In the Bayesian setting, missing data, just like the parameters in the model, are treated as unknown. We used the parameters in the model (intercept, temporal trend, and the effect of covariates) to predict the distribution of native species richness at multiple points in time, whether the site was visited or not. Because we know something about the relationship between native species richness and other site characteristics, we can draw on known values of those other site characteristics to infer native species richness values at unsampled times and places. The information we do have—though incomplete—helps to fill in the gaps created by the complex revisit survey design.
Covariates
We included a covariate to account for a change in botanist, which allowed us to separate changes in the ecological process from changes in the data produced by nonecological factors, such as observer. By including an observer covariate, we could account for the fact that the first two years of sampling were led by a botanist less familiar with the local plants. Omitting this covariate information would have led us to believe there was a strong increase in species richness, when a portion of this variation was actually attributable to the change in observer.
Additionally, we included a covariate for the relative cover of nonnative species. We identified this potential covariate after finding an important relationship between nonnative species cover and native species richness, likely based on competition for resources between these two species groups. The gaps in data on nonnative species cover were filled using the same approach used to fill gaps in our response data (native species richness). We found that native richness declined with increasing nonnative plant cover.
Management Applications
Filling in data missing in time and incorporating covariates offered two specific management applications of the Bayesian approach. Because we were able to include the observer covariate, what might have looked like a strongly increasing trend over time in species richness was partially explained by a change in observer. Additionally, based on the inverse relationship we identified in the dataset between nonnative species cover and native species richness, we were able to model the outcome of different management scenarios. We could help park managers predict how much they might gain in native species richness based on how effectively they limited nonnative species cover.
Soil Stability at Organ Pipe Cactus National Monument

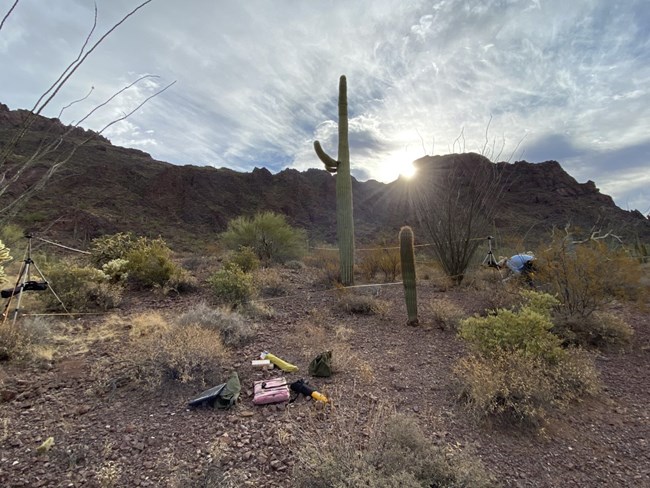
NPS
Organ Pipe Cactus National Monument in southern Arizona protects Sonoran Desert Wilderness and an area rich with human history. Soil stability is monitored in the park as an indicator of health because it is vital to understanding erosion potential in the desert.
Unequal Probability of Inclusion
One of four types of nonignorable missing data in the sampling design for long-term monitoring at Organ Pipe was the unequal probability of including sites in the sampling design. Some potential monitoring sites in remote areas of the park were less likely to be selected because they required a long hike to reach, and thus were more costly. Ignoring the under-sampling of sites that were harder to access can bias results.
Applying the Bayesian Model
Applying Bayesian hierarchical modeling, we were able to account for the unequal probability of inclusion of some sites due to hiking distance. A site’s inclusion probability was inversely related to the estimated hiking time to the site. We included hiking time as a covariate to account for the different inclusion probabilities.
Management Applications
Ignoring unequal inclusion caused us to overestimate soil stability in easier-to-reach sites and underestimate it in more remote sites for some strata, but the opposite was true in other strata. By accounting for the different inclusion probabilities, the Bayesian approach reduced bias in our estimates of soil stability.
Bayesian Modeling and the Problem of Missing Data
Regardless of statistical approach, missing data can be a serious problem. Ignoring missingness in survey designs can result in misleading inference. We recommend that problematic missing data be carefully considered when analyzing long-term monitoring data. Our case studies illustrate a powerful approach to addressing missing data using Bayesian hierarchical modeling.
Depending on the complexity of the design, Bayesian hierarchical modeling is not always necessary, and it does have trade-offs. It requires more statistical expertise and substantially longer computation times. However, it can solve several of the problems inherent in the complex sampling designs for long-term natural resource monitoring in parks. It also surpasses the limited ability of the Horvitz-Thompson design-based estimator to infer trends and determine potential drivers of change.
Inventory and Monitoring Division scientists now have 10 to 20 years of long-term monitoring data at most parks. As they begin analyzing these results for trends, they can use Bayesian hierarchical models to identify covariates and account for missing data more appropriately. Improved models could therefore support more reliable trend analyses. They may also help identify drivers of natural resource conditions to better inform park management.
More Information
Read the paper
Zachmann, L. J., E. M. Borgman, D. L. Witwicki, M. C. Swan, C. McIntyre, and N. Thompson Hobbs. 2021. Bayesian models for analysis of inventory and monitoring data with non-ignorable missingness. Journal of Agricultural, Biological, and Environmental Statistics. Available online at https://doi.org/10.1007/s13253-021-00473-z
Contact
Luke Zachmann
Senior Scientist, Conservation Science Partners
luke@csp-inc.org
Cheryl McIntyre
Ecologist, National Park Service, Chihuahuan Desert Network
cheryl_mcintyre@nps.gov
Megan Swan
Botanist/Ecologist, National Park Service, Southern Colorado Plateau Network
megan_swan@nps.gov
Erin Borgman
Ecologist/Field Coordinator, National Park Service, Rocky Mountain Network
erin_borgman@nps.gov
Carolyn Livensperger
Ecologist, National Park Service, Northern Colorado Plateau Network
carolyn_livensperger@nps.gov
Dana Witwicki
Project Manager, National Park Service, Natural Resource Condition Assessment
dana_witwicki@nps.gov
Tom Hobbs
Professor Emeritus, Department of Ecosystem Science and Sustainability and Senior Research Scientist, Natural Resource Ecology Laboratory, Colorado State University
tom.hobbs@colostate.edu
Prepared by Sonya Daw, Luke Zachmann, and Erin Borgman, in collaboration with Cheryl McIntyre, Megan Swan, Dana Witwicki, Carolyn Livensperger, and Tom Hobbs.
Tags
- capitol reef national park
- little bighorn battlefield national monument
- organ pipe cactus national monument
- bayesian analysis
- monitoring
- sampling design
- rocky mountain network
- romn
- sonoran desert network
- sodn
- northern colorado plateau network
- ncpn
- im
- inventory and monitoring
- inventory and monitoring division
- science
- research
- research brief
- vegetation and soils
- science methods
- science about science
