Last updated: May 18, 2023
Article
Practice Run for Park-wide Water-Quality Assessment at Carolina Coastal Parks

NPS photo / Mark Hynds

NPS photos / Mark Hynds
Soil and Water Tour
Practice makes perfect. That’s the mantra of Eric Starkey and Daniel McCay the SECNs aquatic ecologist and hydrologic technician. To prepare for their Park-wide water quality Assessment at Cape Hatteras and Cape Lookout National Seashores in July, the pair traveled about an hour south of the Southeast Coast Inventory and Monitoring office to Lake Oconee near Greensboro, Georgia. Normally, an annual summer trip to the coast, this double bill was their first time on the water in two years, thanks to COVID travel restrictions in 2020.
Park-wide assessments are conducted in the estuarine waters at coastal parks, providing a snapshot of water-quality conditions. Estuaries are the intersection of freshwater and salty sea water. Their ecosystems are vulnerable to a variety of impacts including natural events like storms, or human elements such as industrial accidents, dredging of shipping lanes and poorly maintained septic systems. Elevated concentrations of nutrients, low dissolved oxygen, or decreased water clarity can have a negative impact on this delicate ecosystem so knowing what’s in the water is critical to protect these aquatic habitats.
Sampling takes place at each park every five years, with sediment quality sampling completed on a 10-year rotation. At each park monitored, between 15 and 30 random sites are selected. Water samples are collected and tested for nitrogen, phosphorous and chlorophyll a. A data sonde is utilized to measure dissolved oxygen, pH, temperature, salinity, turbidity, and Chlorophyll a. A Secchi Disk measures water clarity. Sediment is sampled because environmental contaminants can settle into the bottom then work their way into the food chain eventually, ending up in the stomachs of fish and birds. Lab testing looks for organic contaminants, metals, total organic carbon, and grain size.
While it’s not a coastal estuary, Lake Oconee provided an ideal setting for making sure sampling equipment was in working order, safety gear was ready to go, and “Harriet,” the network’s former boat outfitted for park-wide assessments, was running properly.
The GPS coordinates for each site are loaded into boat’s GPS before leaving the dock. One of the biggest challenges is navigating the shallow waters of the estuaries with tides coming in and out. They use the tide schedule to plan what sites they cover each day. The GPS location of each site is logged with the collected data. If shallow water prevents reaching a site, the goal is to get as close as possible and record the difference in distance along with the GPS coordinates. No issues with tides on Lake Oconee, just lots of submerged trees.
On average, depending on weather and tides, Eric and Daniel will collect data at five sites each day. After the anchor is dropped at the site, work begins. A data sonde, the same device used in fixed-station monitoring, is lowered into the water so it can equilibrate. Data sheets are distributed, and essential information is recorded, including time, GPS coordinates, depth and weather conditions using an anemometer. Photos are taken in each cardinal direction (north, south, east, and west) for reference and additional evidence of the conditions while sampling.
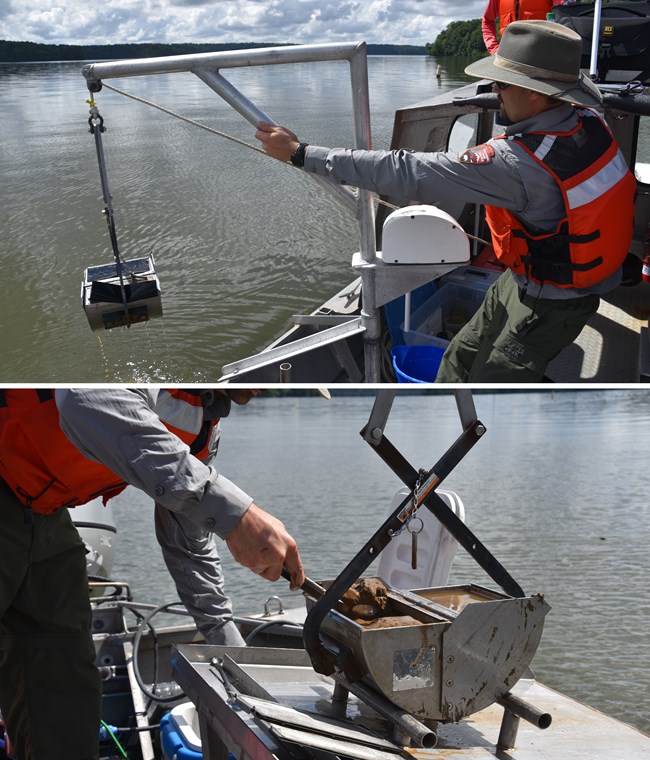
Collecting sediment starts with decontaminating the equipment to ensure a clean sample and nothing from the last site gets included. The sediment is extracted from the bottom using a boat-mounted Ponar sampler-think the arcade toy grabber game except the prize is 5 pounds of wet sand and muck. The sampler, with its “metal jaws”, is lowered down until it reaches the bottom, leaving slack in the line. A pinch pin, or tripping mechanism, allows the sampler shut after the sediment is collected. Getting sufficient sediment is critical so multiple grabs may be necessary.
Once the sampler is in the boat, sediment is spooned out into a stainless-steel container. It must be treated like ice cream and stored in an ice-filled cooler while the workstation is cleaned and prepared for transferring the sediment into jars for the lab. Eric stirs the sample to homogenate it, then spoons it into three jars for analysis. One is for testing organics and metals. The other two are for sediment grain size and total organic carbon. Cleaning up the sampler, the workstation and the rest of the equipment completes the process.
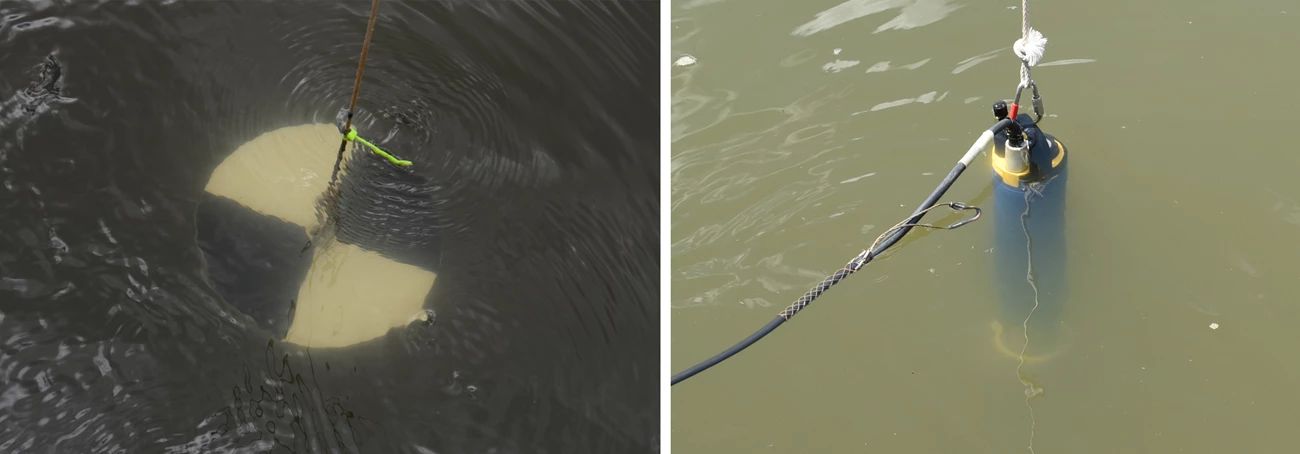
It’s all about the water at the front of the boat and Daniel starts by measuring water clarity with a Secchi disk that resembles a large black and white cookie hanging on a string. He lowers the disk on the shady side of the boat until it is no longer visible. He raises it and when it becomes visible, he notes the depth using the markings on the line. While this method is less precise than water clarity estimated from turbidity and light attenuation sensors (PAR) it is simple and comparable to historic data sets. Turbidity, also a measure of water clarity, is recorded at different levels under the surface with the data sonde.
Getting a water sample is next utilizing a Van Dorn horizontal water sampler. This sampler is essentially a short piece of pipe tied to a rope andopen on both ends. The ends pieces are attached with a rubber band that snaps shut when a weight it dropped on it from the boat. Daniel lowers it 0.5 meters or 1.6 feet below the surface, drops the weight and retrieves it, and pours the collected water into a single sample bottle for processing. Using his portable and floating chemistry set, Daniel prepares the samples for shipment to the lab. The collected sample is vacuumed through a glass microfiber filter into a separate bottle. The filtered water in the bottle is sent to the lab for dissolved nitrogen and phosphorous. The remaining unfiltered water is also bottled and sent for total nutrients nitrogen and phosphorous. The used filter is packaged in aluminum foil and a Ziploc bag for chlorophyll a testing.
The final task is collecting data from the sonde that was lowered in the water when they anchored. Eric takes readings from a handheld device connected to the YSI EX02 multiparameter water quality sonde. Dissolved oxygen, pH, temperature, salinity, turbidity, and chlorophyll a are recorded at 0.1 meter and 0.5 meters below the surface, then at every meter from 1–10 meters (3.3–32.8 feet) both down and back up. These data provide a hydrologic profile from the surface to a depth of 0.5 meter above the bottom.
With data collection complete, Eric and Daniel trade out data sheets and cross checks for any issues. Then, it’s time to pull up the anchor and head to the next site. Fixed-station, or continuous monitoring, is done in the same parks as well, but only at one or two designated or “fixed” sites. While the fixed station continuous monitoring reveals changes to water quality over time, the spatial extent of the park-wide assessments reveals a broad snapshot of conditions throughout or adjacent to the park.
Samples are sent to a contracted lab for testing and analysis. Results are entered into the SECN water- quality database and a data summary report is produced. Much of this report revolves around how the data collected compares to criteria from the EPA, representing the general condition of the estuary and highlighting issues that need attention. It is yet another tool and source of information for park management to use in the protection and preservation of the natural resources in their parks.
Conditions on a sparsely-populated lake in middle Georgia don’t compare to the choppy waters of an estuary near the Outer Banks of North Carolina. But when Eric and Daniel pulled “Harriet” up the ramp to pack up for the short trip back to the network office, they were sure their sampling equipment was functioning properly, and their safety gear was ready to go. Mission accomplished.

NPS photos / Mark Hynds
