Last updated: October 24, 2024
Article
Climate and Water Monitoring at Gila Cliff Dwellings National Monument, Water Year 2019
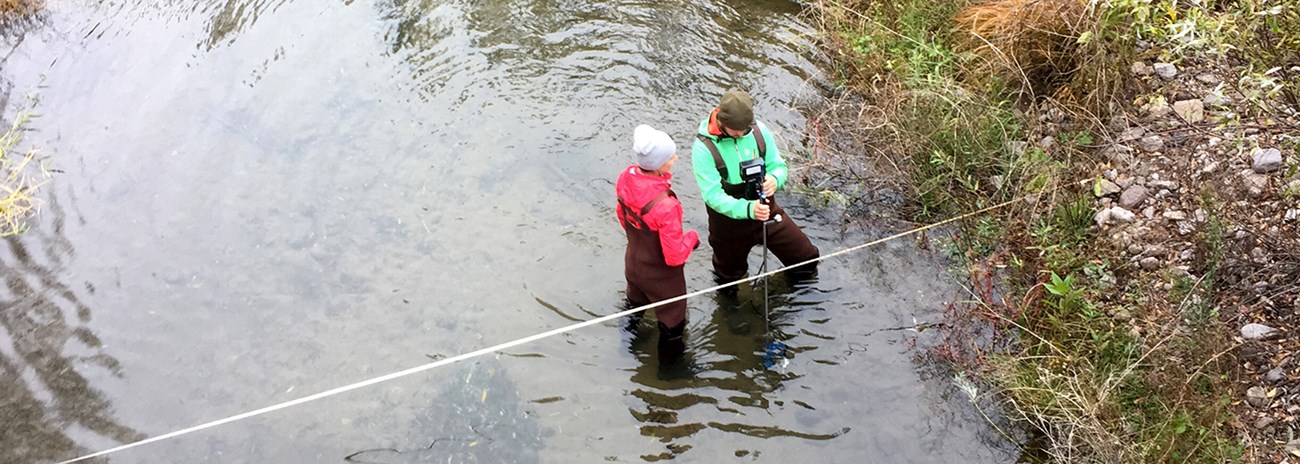
Climate and surface water are closely related. At Gila Cliff Dwellings National Monument, the Sonoran Desert Network monitors both to track broad-scale change and provide early warning of potential problems.
Overview
Together, climate and hydrology shape ecosystem structure and function, particularly in arid and semi-arid ecosystems. Understanding changes in climate, groundwater, and surface water is key to assessing the condition of park biota—and often, cultural resources.
At Gila Cliff Dwellings National Monument, scientists from the Sonoran Desert Network help park managers know what kind of change is happening by taking the same measurements of key resources year after year, much as a doctor keeps track of a patient’s vital signs. This long-term ecological monitoring provides early warning of potential problems, giving managers time to figure out how to mitigate them before they become worse. At Gila Cliff Dwellings, that monitoring includes climate, weather, springs, and streams, among other “vital signs.”
Water conditions are closely related to climate conditions. Because the two are better understood together, the Sonoran Desert Network reports on climate in conjunction with water resources. Reporting is done by water year (WY), which begins in October and ends the following September. Information is added to this page as it becomes available throughout the year.
Climate and Weather
Background
There is often confusion over the terms "weather" and "climate." In short, "weather" describes instantaneous meteorological conditions, such as whether it's currently raining or snowing, or a hot or frigid day. "Climate" reflects patterns of weather at a given place over long periods of time (seasons to years). Climate is the primary driver of ecological processes on earth. Climate and weather information provide a basis for understanding what we see happening in other park vital signs.
An aridity index can be useful for contrasting the climate of national parks and help answer the question, “How dry is dry?” Used globally to classify climate zones, aridity indices are used to compare long-term average annual precipitation relative to the average annual potential evapotranspiration. The climate of Gila Cliff Dwellings National Monument is classified as semi-arid.
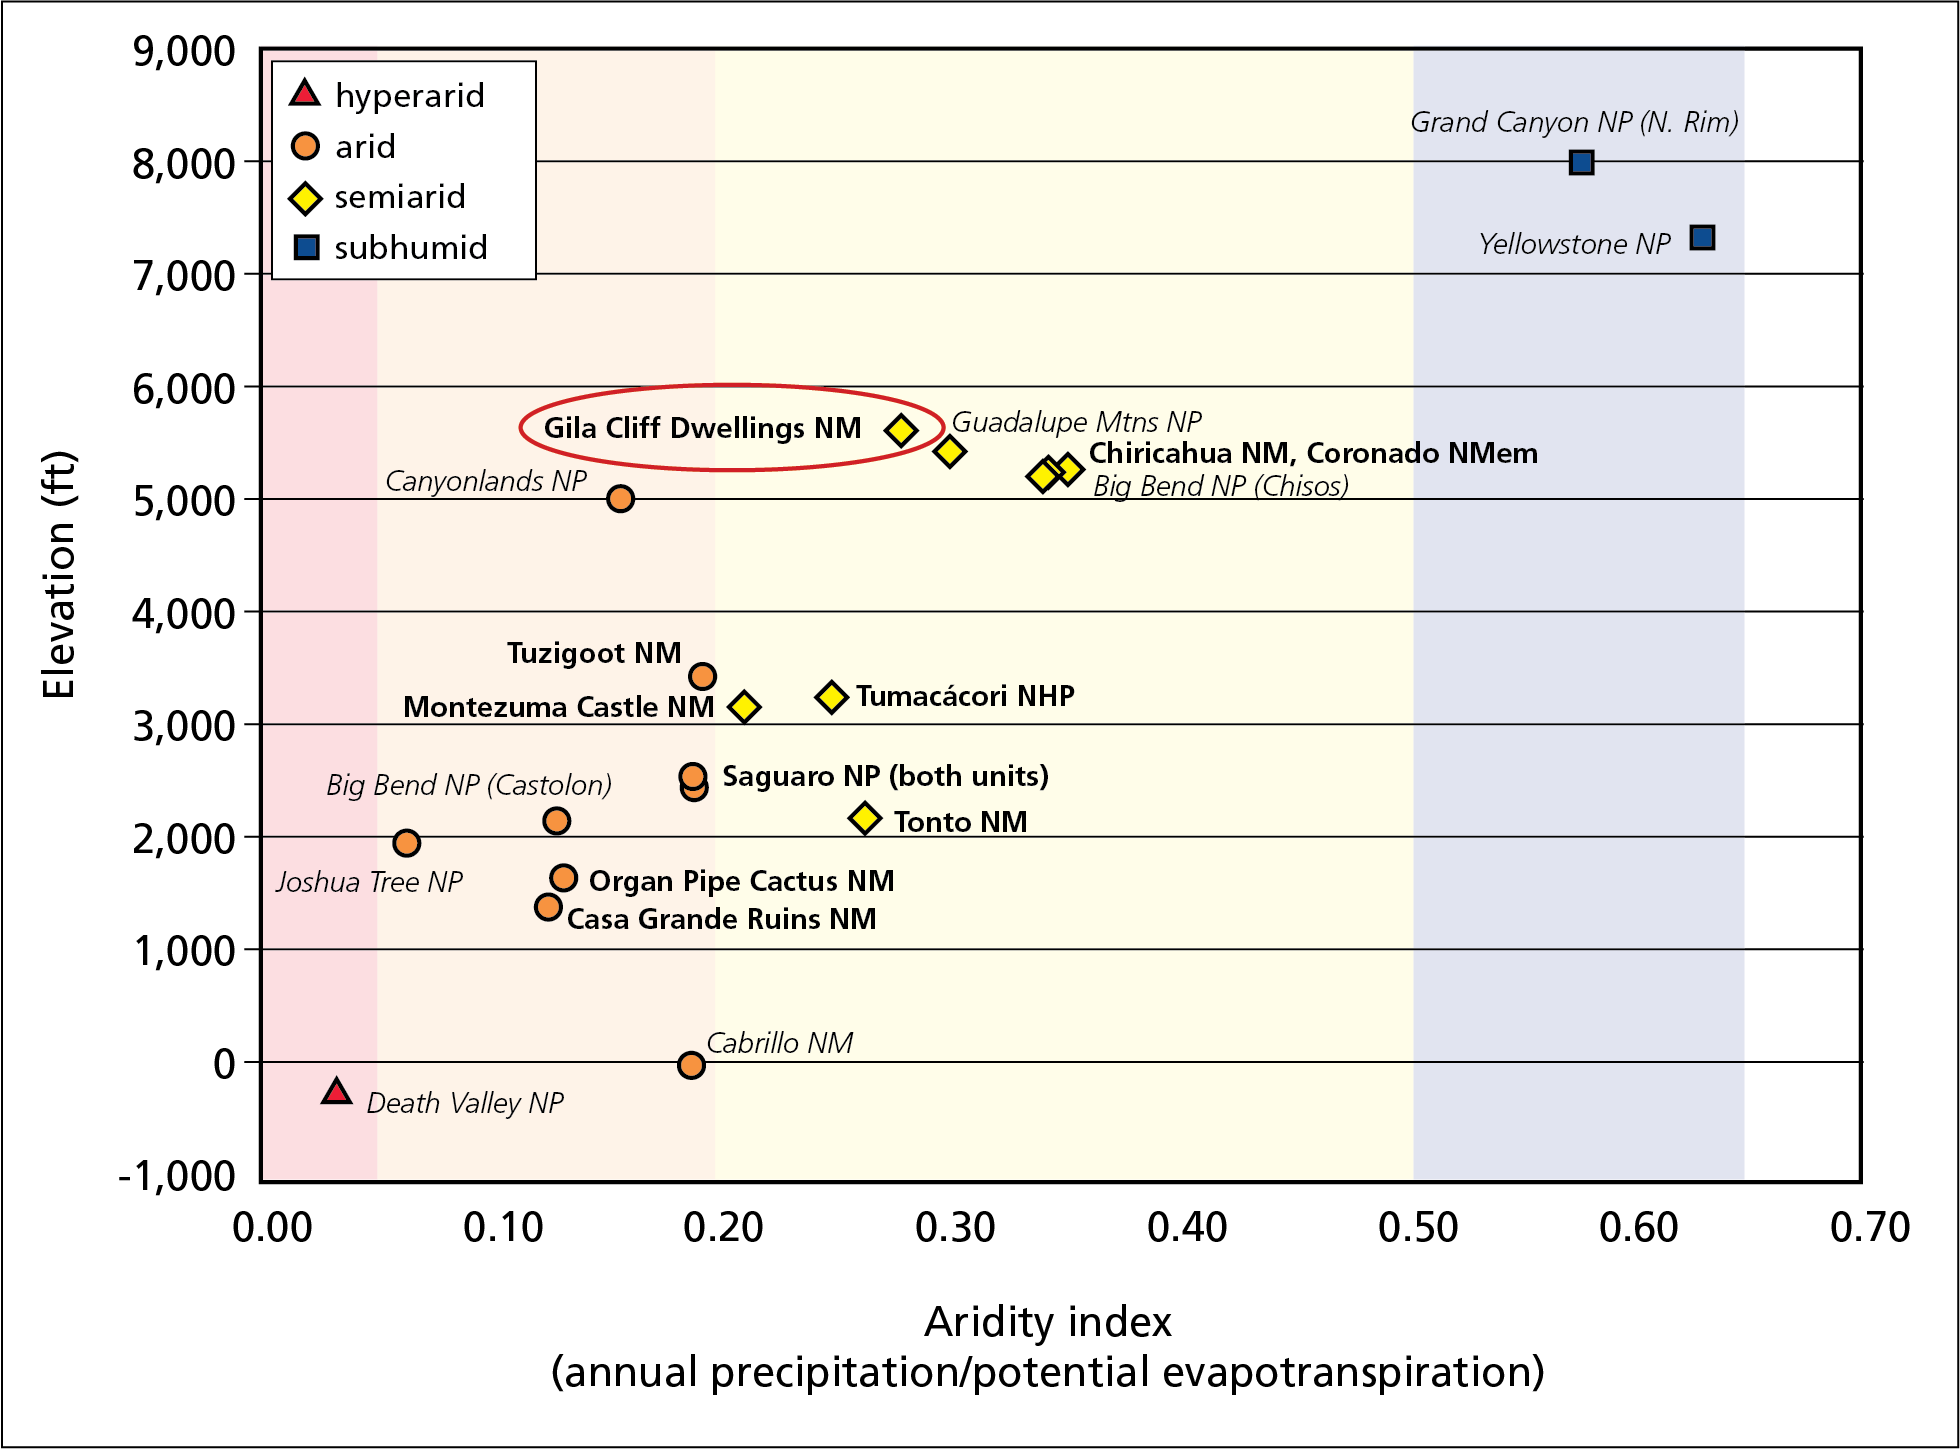
Aridity index vs. elevation of selected national parks, including Gila Cliff Dwellings National Monument.
Methods
Since 1957, a National Oceanic and Atmospheric Administration Cooperative Observer Program weather station (GILA HOT SPRINGS #0293530) has operated near Gila Cliff Dwellings National Monument. This station provides a reliable, long-term climate dataset used for all analyses. The monument has also hosted a Remote Automated Weather Station (RAWS) since 1998. Data from both stations are accessible through the Climate Analyzer.
Recent Findings
Total precipitation at the Gila Hot Springs station in WY2019 was 16.6 inches (42.2 cm) (Fig. A), 0.37 inches (0.94 cm) greater than the 1981–2010 normal. Extreme rainfall events (>1 in/2.54 cm) occurred on 2 days, which is the normal annual frequency. Large events occurred on July 7 (1.12 in/2.84 cm) and August 4 (1.53 in/3.89 cm).
Mean annual air temperature in WY2019 was within 1°F (0.56°C) of normal (Fig. B). However, maximum temperatures were generally greater than normal in June–September. The August mean maximum temperature of 91.6°F (33.1°C), was 7.1°F (4.5°C) above normal. Extremely hot temperatures (>92.0°F/33.3°C) occurred on 37 days, which was 2.5 times the normal frequency.
Reconnaissance drought index provides a measure of drought severity and extent relative to the long-term climate based on the ratio of average precipitation to average potential evapotranspiration over shorter periods of time (seasons to years). The reconnaissance drought index for Gila Hot Springs in WY2019 (Fig. C) indicated an average year from the perspective of both precipitation and evaporative demand.
Click graphics to enlarge

Figure B. Departures from 30-year normal minimum and maximum air temperature and precipitation, WY2019.
Figure C. Reconnaissance drought index, WY1981–2019. “N/A” = insufficient data to generate reliable estimates. The station was abandoned from 2007 to 2010.
Graphics generated by climateanalyzer.org
Springs
Background
Springs, seeps, and tinajas are small, relatively rare biodiversity hotspots in arid lands. They are the primary connection between groundwater and surface water, and are important water sources for park plants and animals. For springs, the most important questions we ask are about persistence (How long was there water in the spring?), and water quantity (How much water was in the spring?).
Methods
Read Methods section
Sonoran Desert Network springs monitoring is organized into four modules, described below.
- Site characterization provides context for interpreting change in the other modules. It describes the spring type and its associated vegetation, and contains GPS locations and a site diagram. This module is completed once every five years, or after significant events.
- Site condition assesses the condition of the site. We measure natural and anthropogenic disturbance and the level of stress on vegetation and soils on a scale of 1–4, where 1 = undisturbed, 2 = slightly disturbed, 3 = moderately disturbed, and 4 = highly disturbed. Types of natural disturbance can include flooding, drying, fire, wildlife, windthrow of trees and shrubs, beaver activity, and insect infestations. Anthropogenic disturbances can include roads and off-highway vehicle trails, hiking trails, livestock, feral animals, removal of invasive non-native plants, flow modification, and evidence of human use. Repeat photographs show the spring and its landscape context. We note the presence of certain obligate wetland plants (plants that almost always occur only in wetlands), facultative wetland plants (plants that usually occur in wetlands, but also occur in other habitats), and non-native crayfish and bullfrogs; and record the presence and density of invasive non-native plants.
- The water-quantity module measures the persistence of surface water, amount of spring discharge, and wetted extent. To estimate persistence, we analyze the variance of temperature measurements taken by electronic data recorders placed at or near the orifice (or in a tinaja). The water above a submerged sensor mediates variation in diurnal temperatures. Surface discharge is measured with a timed sample of water volume. Wetted extent is a systematic measurement of the physical length (up to 100 m), width, and depth of surface water.
- Water-quality monitoring measures core water-quality parameters and water chemistry. Core parameters include water temperature, pH, specific conductivity (a measure of dissolved compounds and contaminants), dissolved oxygen (how much oxygen is present in the water), and total dissolved solids (an indicator of potentially undesirable compounds). Discrete samples of these parameters are collected with a multiparameter meter. Water chemistry is assessed by collecting a surface-water sample(s) and estimating the concentration of major ions with a photometer.
More details on methods are available in the Sonoran Desert Network's springs monitoring protocol.
Recent Findings
Cliff Dweller Canyon Spring
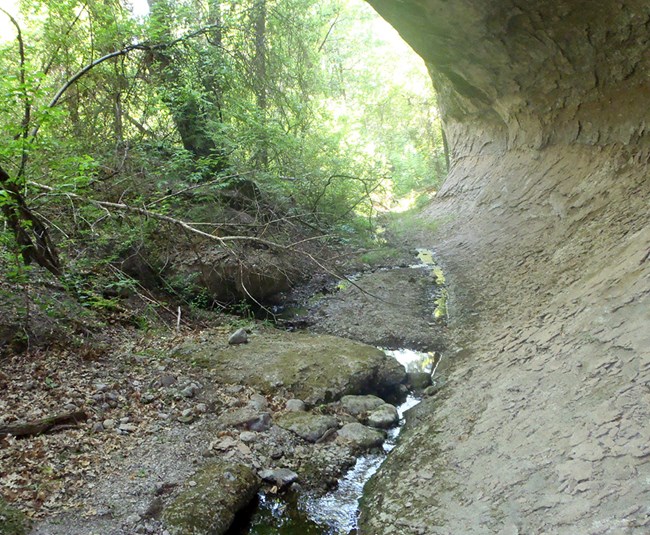
Cliff Dweller Canyon Spring is a rheocrene spring (a flowing spring that emerges into one or more stream channels). When last characterized (in water year 2017), the spring emerged near a large bedrock wall as a pool below a boulder. The springflow immediately became a shallow, narrow brook, ending as it entered the ground downstream. The brook was interrupted by scattered pools and small, braided sections. The substrate was sand, gravel, and small cobble, with patches of bedrock. The water was uniformly cold and clear, even in pools where flow lost velocity. There did not appear to be surface flow upstream of where the spring emerged from the bed of the ephemeral stream.
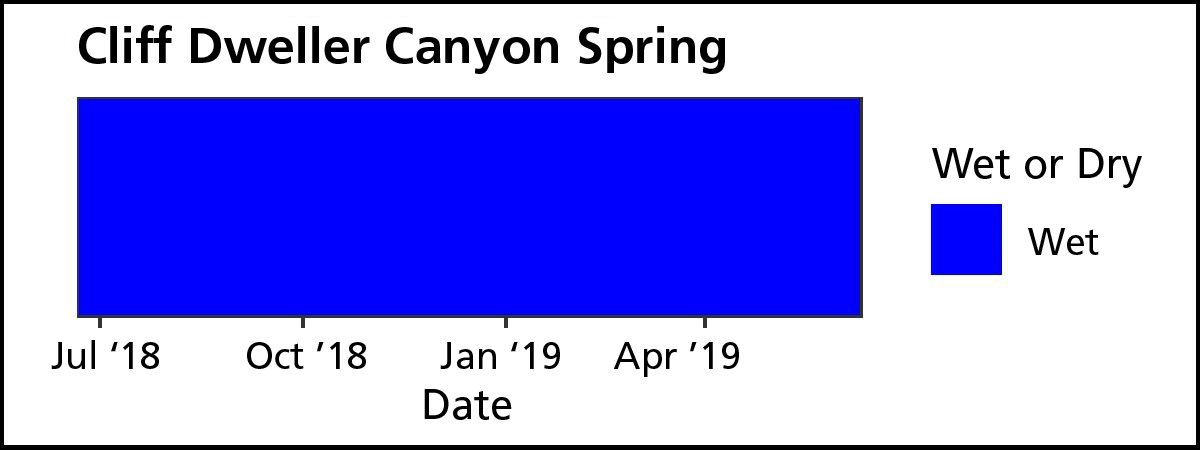
Temperature sensors indicated that Cliff Dweller Canyon Spring was “wetted” (contained water) during all of WY2019 (October 2018–September 2019). Discharge was estimated at 17.3 (± 0.33) liters (4.6 ±0.1 gal) per minute. The spring’s brook was >500 meters (>1,640 ft) long. Width and depth averaged 71.7 centimeters (28.2 in) and 2.5 centimeters (1 in), respectively, within the first 100 meters.
The site was classified as undisturbed, with minimal evidence of wildlife disruption in the form of trampling and tracks. No obligate/facultative wetland plants were observed, but two invasive plants were noted at low density (1–5 individuals): common mullein (Verbascum thapsus) and stinkgrass (Eragrostis cilianensis). No invasive crayfish or bullfrogs were observed.
Core water quality and water chemistry for water year 2019 were measured at the first pool downstream of the orifice (emergence point). Water-quality data were sampled at 8:15 am, in the shade.
| Sampling location | Temperature (°C) | Dissolved oxygen (mg/L) | pH | Specific conductivity (µs/cm) | Total dissolved solids (mg/L) | Exposure |
| Cliff Dweller Canyon Spring | 12.1 | 7.41 | 7.24 | 217.9 | 141.7 | Shade |
| Sampling location | Alkalinity (mg/L) | Calcium (mg/L) | Chloride (mg/L) | Magnesium (mg/L) | Potassium (mg/L) | Sulfate (mg/L) |
| Cliff Dweller Canyon Spring | 115 | 28 | 6 | 8 | 1.1 | 1 |
Hubbard's Bog
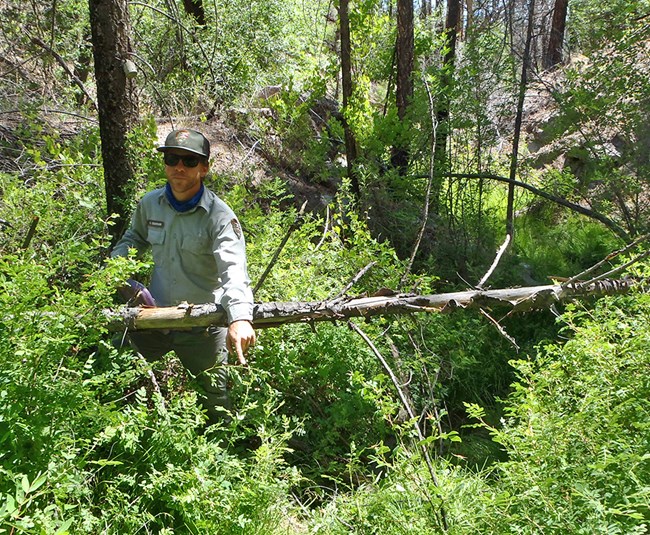
Hubbard’s Bog is another rheocrene spring. When last characterized (in water year 2017), the spring emerged in the canyon bottom as a small brook with no obvious flow. It continued downstream as a low-flow brook with occasional small pools. Beyond the sampled extent, the brook continued intermittently downstream, never with the same volume of water or density of riparian vegetation found at the emergence site. Though rarely flowing, the water was cool and clear throughout. The drainage was characterized as primarily a low-angle silt and gravel streambed with occasional boulders and frequent snags. The brook's channel was very narrow. The drainage upstream of the orifice (emergence point) did not appear to contain flowing surface water. Steep canyon backslopes emerged immediately, with no obvious riparian character. Disturbance caused by the 2011 Miller Fire was notable in the form of sedimentation and downed trees.
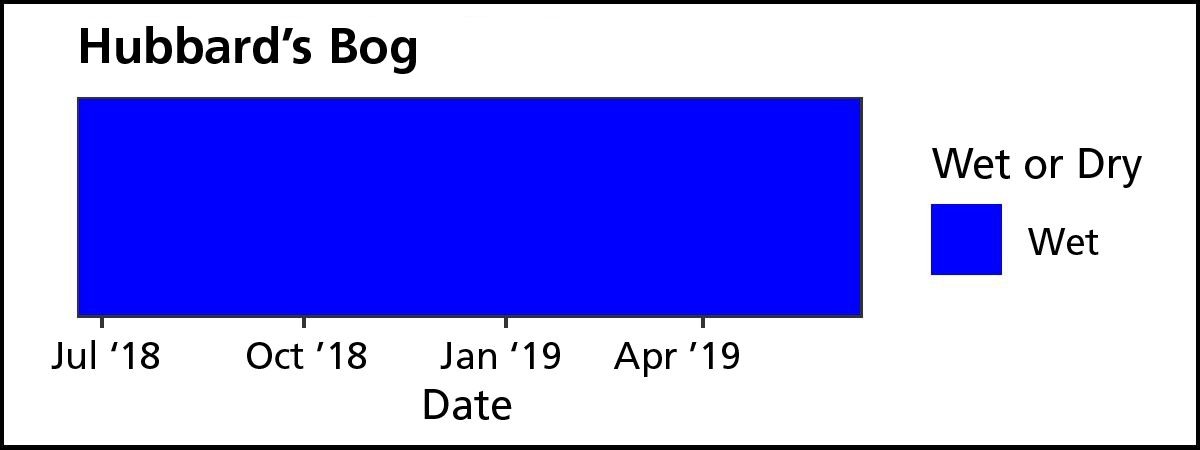
Temperature sensors indicated that Hubbard’s Bog was “wetted” (contained water) for all of water year 2019 (October 2018–September 2019). Discharge was estimated at 0.69 (±0.02) liters (0.18 ±0.01 gal) per minute. However, the crew noted that subsurface flow may have caused inaccurate measurements at this location. The spring’s brook was 40 meters (131 ft) long. Width and depth averaged 55.7 centimeters (21.9 in) and 2.9 centimeters (1.1 in), respectively.
The site was classified as undisturbed, with minimal evidence of wildlife disruption in the form of trampling and tracks, and evidence of windthrow disturbance. The crew observed one family and two genera of obligate/facultative wetland plants: rushes (Juncaceae), monkeyflower (Mimulus sp.), and willow (Salix sp.). The invasive, common mullein (Verbascum thapsus), was noted at low density (1–5 individuals). No invasive crayfish or bullfrogs were observed.
Core water quality and water chemistry were measured at the first pool downstream of the orifice (emergence point). Water-quality data were sampled at 9:10 am, in the shade.
| Sampling location | Sample time | Temperature (°C) | Dissolved oxygen (mg/L) | pH | Specific conductivity (µs/cm) | Total dissolved solids (mg/L) | Exposure |
| Hubbard’s Bog | 09:10 | 12.5 | 0.72 | 6.91 | 291.9 | 189.8 | Shade |
| Sampling location | Alkalinity (mg/L) | Calcium (mg/L) | Chloride (mg/L) | Magnesium (mg/L) | Potassium (mg/L) | Sulfate (mg/L) |
| Hubbard’s Bog | 140 | 40 | 0 | 12 | 0.5 | 2 |
Streams
Background
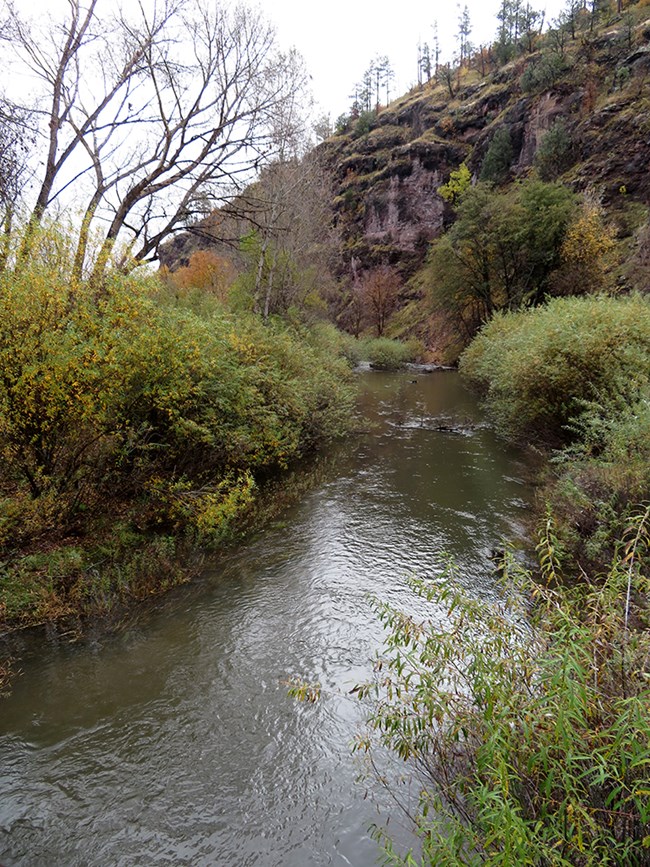
Streams, and their associated riparian areas, are critical to ecological integrity. Riparian areas supply food, cover, and water, and serve as wildlife migration routes. They also help control water pollution, reduce erosion, mitigate floods, and increase groundwater recharge. Riparian systems perform numerous ecosystem functions important to humans, yet are one of the most endangered forest types in the United States. The West Fork Gila River, which crosses the northeastern portion of Gila Cliff Dwellings National Monument, is a mountainous stream located in the Gila Wilderness. There is almost no upstream land use and little visitor impact in its small watershed.
Natural stressors include drought, flooding, and fire. Since 2001, drought has decreased flow in the stream, which sometimes runs dry near the park’s eastern boundary. This area is also prone to flooding. Inside the park, the floodplain is bounded by canyon walls that act as a bottleneck, increasing the destructive force of high flood waters. In 2008, a large rain-on-snow event carved a new stream channel and washed out camping facilities and a bridge, resulting in necessary repairs and reduced visitation.
Two major fires have burned in the watershed in recent years: the 2011 Miller Fire and the Whitewater–Baldy Fire, in 2012. Impacts from these fires have included degraded aquatic habitat, exotic-plant establishment, and potential future flooding and channel change.
Methods
Read Methods section
Sonoran Desert Network streams monitoring is organized into six modules, described below. Sampling for water quality and quantity is conducted at the West Fork Gila River index site (see map). Macroinvertebrate sampling is done at the index reach. Stream-channel morphology and riparian vegetation surveys are collected every five years along the stream segment.
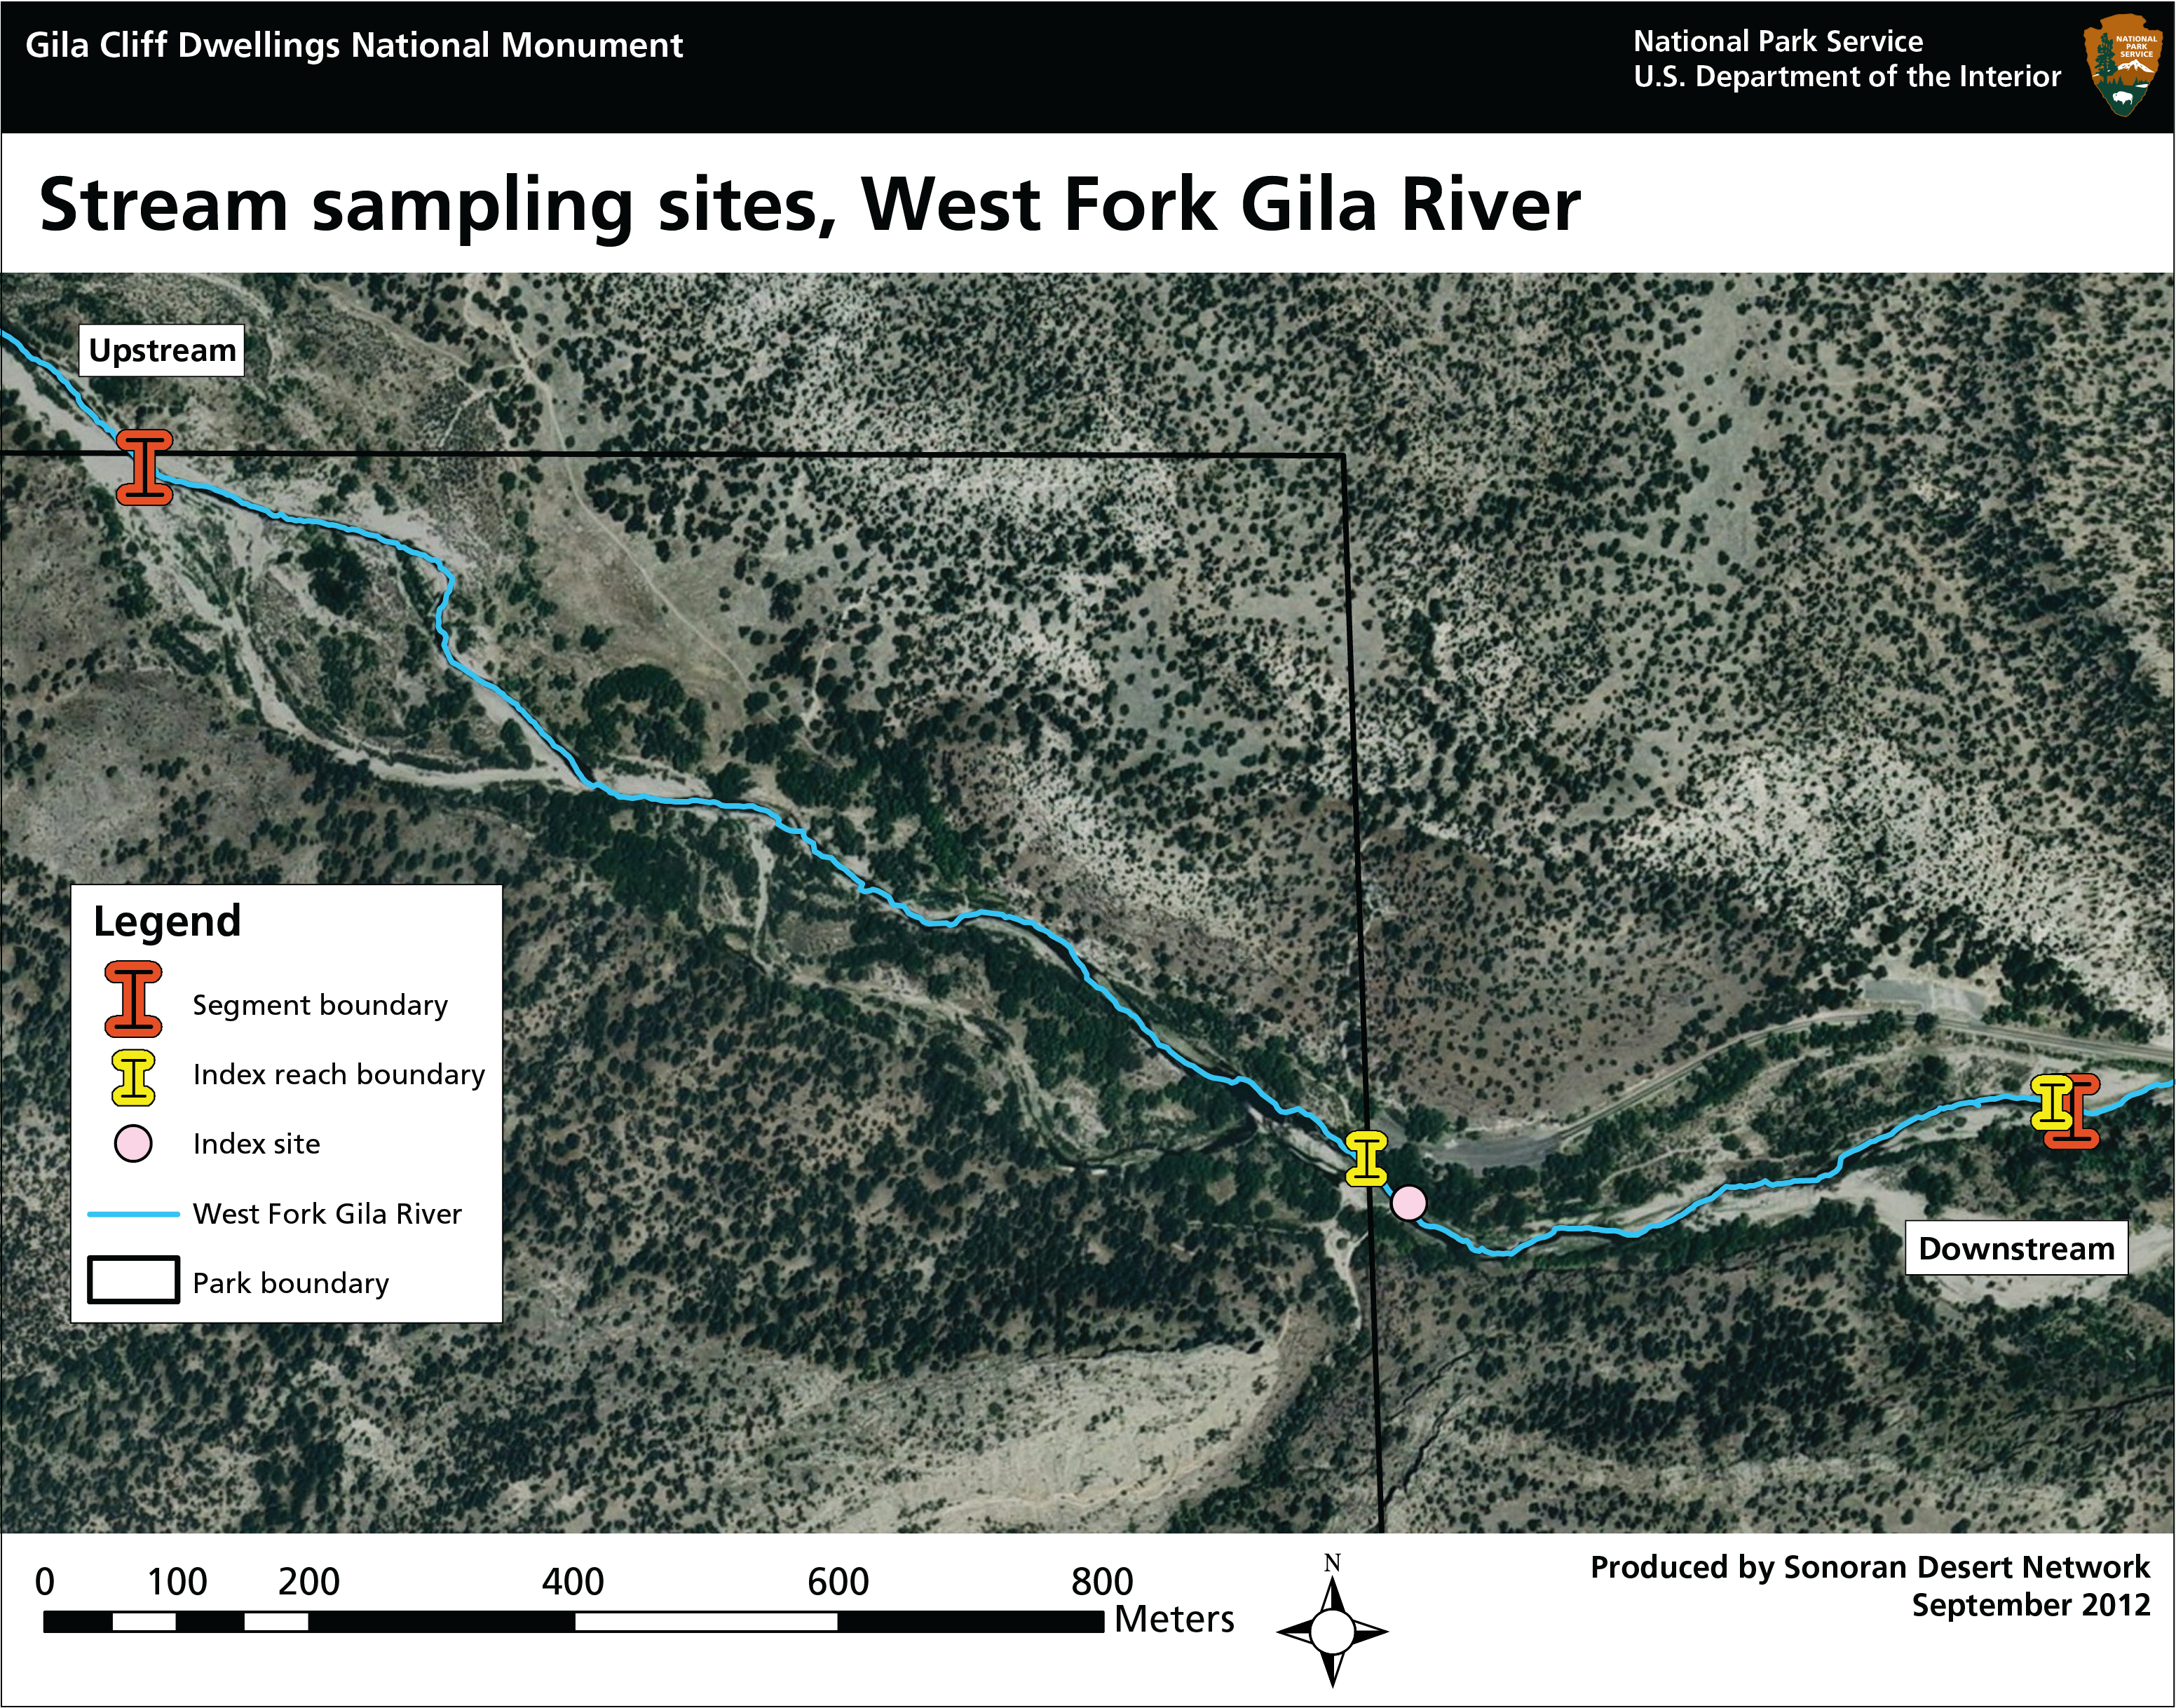
Sampling locations on the West Fork Gila River, Gila Cliff Dwellings National Monument.
- Core water-quality parameters provide the most basic level of information about water quality. During each site visit, water-quality samples are collected in a three-liter sample collection bottle, following non-isokinetic sampling methods as described in the U.S. Geological Survey’s National Field Manual for the Collection of Water Quality Data. We transfer the sample water to bottles for analysis of bacteria, turbidity, metals, and other constituents. The sample water is filtered and/or treated as required, kept on ice, and dropped off at the contract laboratory for analysis. Water temperature, pH, specific conductivity, dissolved oxygen, turbidity, and discharge are sampled using the following methods:
- On arrival at the site, a multi-parameter meter is calibrated and deployed in a well-mixed part of the stream channel, logging temperature, pH, specific conductivity, and dissolved oxygen data at one-minute intervals. The meter is left in the stream for the entire visit.
- Turbidity samples are collected and analyzed within one hour using a portable turbidimeter.
- Discharge is measured using a FlowTracker Acoustic Doppler Velocimeter.
- In addition to regular sampling, we use a logging multi-parameter instrument to collect data on temperature, pH, specific conductivity, and dissolved oxygen at 15-minute intervals for a minimum of two weeks each quarter.
- Water quantity is recorded by a Waterlog radar gage (USGS 09430010) mounted to the bottom of the footbridge across the West Fork Gila River. This station uses a radar water-level telemetry system. Every 15 minutes, the gage sends a pulse of electromagnetic energy down toward the surface of the river and measures the reflected energy to determine the distance from the radar to the water surface, thereby measuring the elevation of the water. This instrument is attached to a its data recorder and telemetry system using the National Weather Service GOES satellite system. This allows for remote real-time access and logging of water-level data, available from the Climate Analyzer.
- Aquatic macroinvertebrates and habitat are monitored in a 570-meter stream reach starting upstream of the park’s western boundary and continuing onto U.S. Forest Service land. The reach contains 11 equally spaced transects. At each transect, we measure wetted width, water depth, velocity, and canopy cover; estimate substrate size, bank erosion (using the Rosgen Bank Erosion Hazard Index), and diversity of aquatic habitat. Quantitative and qualitative samples are collected and sent to the National Aquatic Monitoring Center (BugLab), a Bureau of Land Management laboratory at Utah State University in Logan, Utah. There, a taxonomist certified by the North American Benthological Society identifies all aquatic macroinvertebrates to the lowest taxonomic level possible.
- Channel morphology surveys include up to 11 channel cross-sections, a longitudinal survey, and pebble count. A transit total station (an optical instrument used in surveying) and survey-grade GPS are used to survey the cross-section and longitudinal profiles. Within the low-flow channel, crews use a gravelometer to categorize the size of 250 particles.
- Riparian vegetation is measured along transects and within plots that are arrayed along the channel morphology cross-sections. Crews conduct line-point intercept on 20-m long transects along the greenline (the first line of perennial vegetation along the bank of the stream) and within the riparian zone. They also note all species within 1m of the transect. The density of trees and shrubs is recorded within nested plots. Legacy trees are mapped and characterized.
- Fish surveys are conducted by other agencies and organizations. The Sonoran Desert Network incorporates their information when available.
More details on methods are available in the Sonoran Desert Network's streams monitoring protocol.
Recent Findings
Data Summary
See Results to date
Results in this section have been certified through the network’s QA/QC process. Only parameters with results are reported. Parameters not reported should not assumed to be zero, but rather below the detection limit of the analytical equipment. They may have been present in very low concentrations. Parameters reported with a “<” symbol are not assumed to be zero, but rather below the detection limit of the analytical equipment. They may have been present in very low concentrations.
Table 1. Sampling dates for core water-quality parameters, West Fork Gila River, WY2019.
| Quarter | Sample date |
|---|---|
| Q1 | 10/18/2018 |
| Q2 | 2/7/2019 |
| Q3 | 6/13/2019 |
| Q4 | 10/19/2019 |
Table 2. Discrete data summary for core water-quality parameters, West Fork Gila River, WY2019.
| Parameter | Q1 | Q2 | Q3 | Q4 | New Mexico state standard value |
New Mexico state standard |
|---|---|---|---|---|---|---|
| Temperature (°C) | 12.4 | 2.1 | 13.1 | 17.3 | <23A | High Quality Coldwater Aquatic Life |
| Specific conductivity (µS/cm) | 134.5 | 69.1 | 114.6 | 138.1 | <400 | Park-Specific |
| Turbidity (NTU) | 1.80 | 16.6 | 1.06 | 6.05 | <10 over backgroundB | General |
| pH | 7.26 | 7.36 | 7.14 | 7.01 | 6.6–8.8 | High Quality Coldwater Aquatic Life |
| Dissolved oxygen concentration (mg/L) | 8.08 | 10.59 | 6.93 | 6.64 | >6 | High Quality Coldwater Aquatic Life |
| Discharge | 13.6 | 83.2 | 6.28 | 6.78 | NS |
Table 3. Sonde deployment date and number of samples collected, West Fork Gila River, WY2019.
| Quarter | Sample period | #samples |
|---|---|---|
| Q1 | 10/6/2018–11/7/2018 | 2,108 |
| Q2 | No probe deployed | no data |
| Q3 | 5/1/2019–5/15/2019 | 1,382 |
| Q4 | 7/17/2019–8/5/2019 | 1,818 |
Table 4. Results (mg/L) from nutrient sampling, West Fork Gila River, WY2019.
| Parameter | Q1 | Q2 | Q3 | Q4 | MethodA | New Mexico state standard |
|---|---|---|---|---|---|---|
| Nitrogen, Kjeldahl | 0.21 | <1 | <1 | <1 | 351.2 | No standard |
| Nitrogen, Total | 0.21 | <0.1 | <0.1 | <0.1 | Total Nitrogen | No standard |
Table 5. Results (mg/L) from biological condition sampling, West Fork Gila River, WY2019.
| Parameter | Q1 | Q2 | Q3 | Q4 | MethodA | New Mexico state standard measure | Beneficial use |
|---|---|---|---|---|---|---|---|
| Total Organic Carbon | NCB | NCB | NCB | 1.1 | SM 5310B | No standard | No standard |
| E. coli (MPNC | 16.4 | 4.13 | 21.7 | 28.9 | SM 9223B | 235 (single sample) | Park-specific |
Table 6. Results (mg/L) metal and metalloids (dissolved) sampling, West Fork Gila River, WY2019.
| Parameter | Q1 | Q2 | Q3 | Q4 | MethodA | New Mexico state standard measure | Beneficial Use |
|---|---|---|---|---|---|---|---|
| Barium | NCB | NCB | NCB | 0.0058 | 200.8 | 2 | Domestic Water Supply |
| Calcium | 15 | 6.7 | 13 | 15 | 200.7/200.7 Rev 4.4 | No standard | – |
| Copper | <0.015 | <0.015 | <0.015 | 0.003 | 200.7/200.8 | CalculatedC | Aquatic Life - Chronic |
| Magnesium | 3.2 | 1.9 | 2.6 | 2.8 | 200.7 | No standard | – |
| Manganese | 0.012 | <0.01 | <0.01 | 0.0085 | 200.7/200.8 | CalculatedC | Aquatic Life - Chronic |
| SiO2, Silica | 28 | 21 | 31 | 30 | 200.7/200.7 Rev 4.4 | No standard | – |
| Sodium | 8.4 | <5 | 7.2 | 9.1 | 200.7 | No standard | – |
Table 7. Results (mg/L) metal and metalloids (total) sampling, West Fork Gila River, WY2019.
| Parameter | Q1 | Q2 | Q3 | Q4 | MethodA | New Mexico state standard measure | Beneficial Use |
|---|---|---|---|---|---|---|---|
| Aluminum | <0.1 | 3.4 | <0.1 | 0.16 | 200.7/200.7 Rev 4.4 | CalculatedB | Aquatic Life - Chronic |
| Barium | NCC | NCC | NCC | 0.0063 | 200.8 | No standard | – |
| Calcium | 15 | 7.2 | 12 | 15 | 200.7/200.7 Rev 4.4 | No standard | – |
| Iron | <0.1 | 1.3 | <0.1 | <0.1 | 200.7/200.7 Rev 4.4 | No standard | – |
| Magnesium | 3.2 | 2.2 | 2.6 | 2.8 | 200.7 | No standard | – |
| Manganese | 0.014 | 0.02 | <0.01 | 0.016 | 200.7/200.8 | No standard | – |
| SiO2, Silica | 29 | 33 | 27 | 32 | 200.7/200.7 Rev 4.4 | No standard | – |
| Sodium | 8.4 | <5 | 7.3 | 9.5 | 200.7 | No standard | – |
Table 8. Results (mg/L) from suspended and total sediment sampling, West Fork Gila River, WY2019.
| Parameter | Q1 | Q2 | Q3 | Q4 | MethodA | New Mexico state standard |
|---|---|---|---|---|---|---|
| Total dissolved solids | 100 | 100 | 87 | 120 | SM 2540C | No Standard |
| Total suspended solids | <4 | 9.6 | <4 | 12 | SM 2540D | No Standard |
Table 9. Results (mg/L) from general and inorganic sampling, West Fork Gila River, WY2019.
| Parameter | Q1 | Q2 | Q3 | Q4 | Method1 | New Mexico state standard |
|---|---|---|---|---|---|---|
| Alkalinity as CaCO3 | 64 | 28 | 70 | 67 | SM 2320B | No standard |
| Bicarbonate Alkalinity as CaCO3 | 64 | 28 | 69 | 67 | SM 2320B | No standard |
| Fluoride | 0.79 | <0.5 | 0.71 | 0.83 | 300 | No standard |
| Hardness, as CaCO3 | 51 | 27 | 41 | 50 | SM 2340B | No standard |
| Anion/Cation Balance | 2.1 | -6.6 | -12 | -0.28 | SM 1030E | No standard |
Annual Summary
Supporting data can be found in the “Data Summary” section (see above).
Water quality
In WY2019, SODN staff made a total of four sampling visits to the West Fork Gila River index site. Discrete samples were collected in each quarter. Continuous sampling occurred during deployment periods in quarters 1, 3 and 4. Sampling did not occur in Q2 due to low winter temperatures beyond the measurement abilities of the logging multi-parameter sonde. Water-quality monitoring occurred at the index site near the park’s eastern boundary (see map above).
A total of 243 discrete analyses were performed on water samples collected in WY2019. Of these, 89 were associated with state standards. There was one exceedance of New Mexico state water-quality standards noted in these samples, for Total Aluminum in quarter three. The compliance rate was 99%.
The state standard for dissolved oxygen “Beneficial Use” (NMAC 2013) indicates that oxygen levels cannot drop below 6 mg/L. During the Q4 sonde deployment (continuous sampling), 3% of the 1,818 measurements did not meet this standard. These events corresponded with short periods (<4 hours) of elevated water temperatures above 23°C.
Core parameters
Discrete sampling—. Results for discrete measurements were all within the expected range for a mid-elevation stream in New Mexico.
Continuous sampling—. A logging multi-parameter sonde was deployed for 2–3 weeks during quarters 1, 3, and 4 of WY2019 to collect measurements of temperature, pH, specific conductivity, and dissolved oxygen at 15-minute intervals. A total of 5,308 measurements were collected. The sonde was not deployed during the second quarter of WY2019 due to concern over possible ice damage to the sonde. The sonde sampling location is currently at a secondary site, approximately 100 meters downstream from the footbridge. The primary site was located upstream from the footbridge but was abandoned after stream movement stranded the site out of the water away from the active channel.
Nutrients
There were no exceedances of state water quality standards for nutrients in WY2019. Other results were within expected ranges.
Biological condition
No exceedances were detected for this parameter group, which includes E. coli. The bacterium E. coli is a naturally occurring member of the biotic community. It is found in soil, decaying material, and the guts of mammals. It is used as an indicator of contamination of water by human fecal waste. SODN data for total coliforms and E. coli are expressed as a most probable number (MPN) per 100 mL of stream water, a statistical estimate of the number of bacteria. Although water-quality criteria are expressed as colony-forming units (cfu) per 100 mL (which, unlike MPN, does not assume estimation), the two units are comparable.
Metals and metalloids
There was one exceedance of state water quality standards for metals and metalloids in WY2019. In winter, Total Aluminum measured 3.4 mg/L, well above the calculated standard of 0.23 for chronic aquatic life. In spring, the anion/cation balance was outside of the expected range criteria of 5%. Anion/cation balance is a QA/QC metric assessing if all the anions and cations were considered in the analysis in total. A result such as the one from this sample period indicates that analytes were present but not tested, or there were inconsistencies with function or QC with the lab equipment. SODN staff is investigating the cause of this result. Other results were within expected ranges.
Suspended and total sediment
Results for suspended and total sediment fell within the expected range during WY2019.
General water quality and inorganics
Results for general water quality and inorganics were within the range of expected values during WY2019.
Water quantity
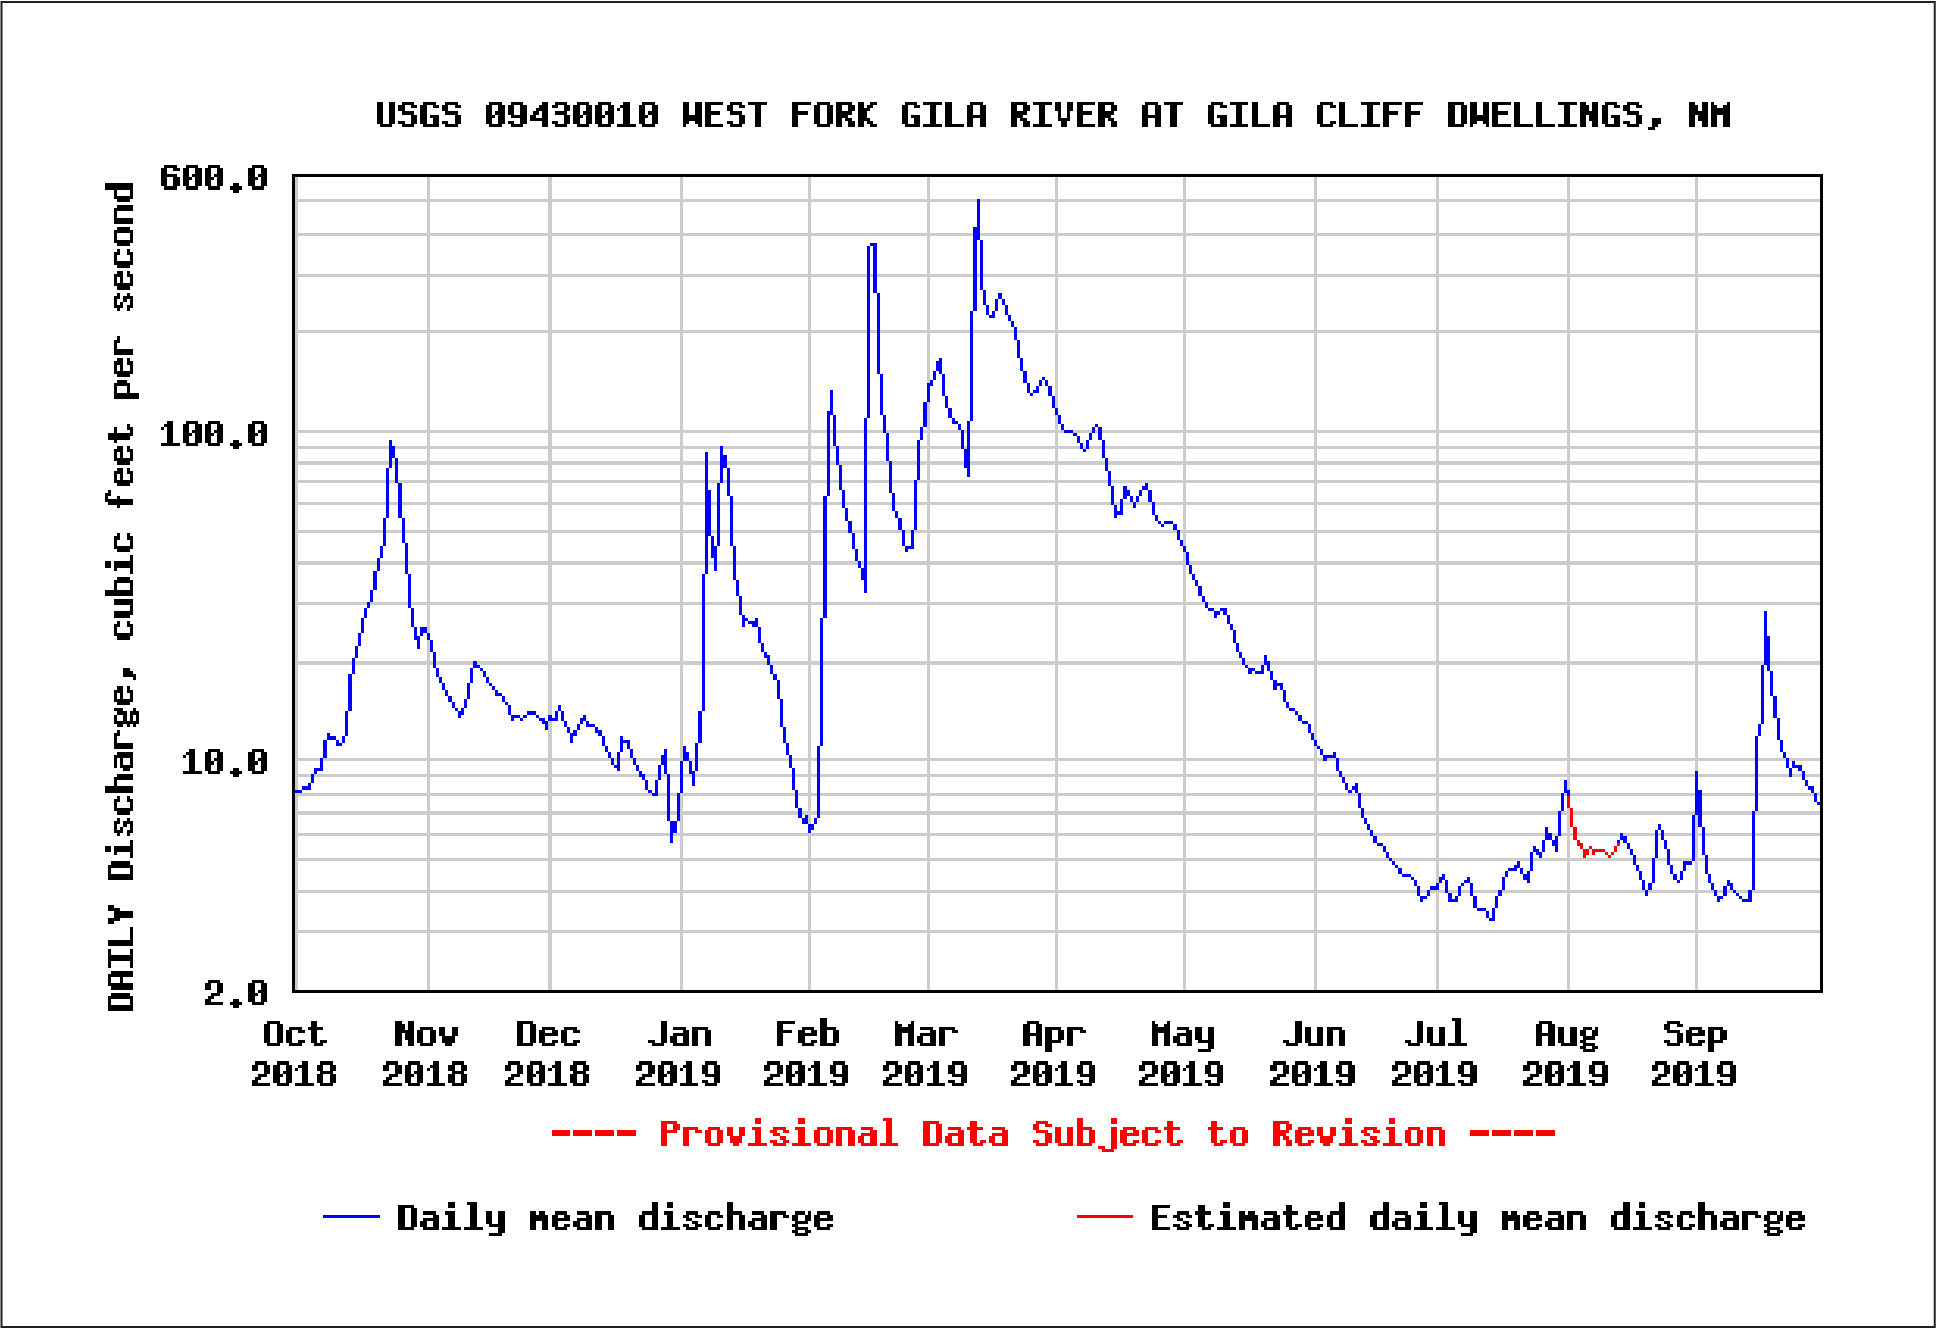
The hydrograph for WY2019 was typical of the Upper Gila Basin (NPS 1998). Peak streamflow occurred during late February to early April, corresponding to snowmelt in the watershed. The largest flow event, at 754 cfs (cubic feet per second) occurred on March 13, 2019. Mean annual discharge at the park’s index station was 34.76 cfs (SD 58.75) in WY2019. The median was 11.0 cfs.
Macroinvertebrates
Macroinvertebrate samples and associated habitat data were collected on October 17, 2018. A list of taxa collected from the index reach can be found in Appendix B. The State of New Mexico uses the New Mexico Stream Condition Indices (Jacobi et. al 2006) to meet mandates established by the U.S. Environmental Protection Agency. In WY2019, the index was measured at 48.37. This placed Gila Cliff Dwellings NM in the “fair” category, falling in the middle of New Mexico index sites quality in the “high-elevation small watershed” class.
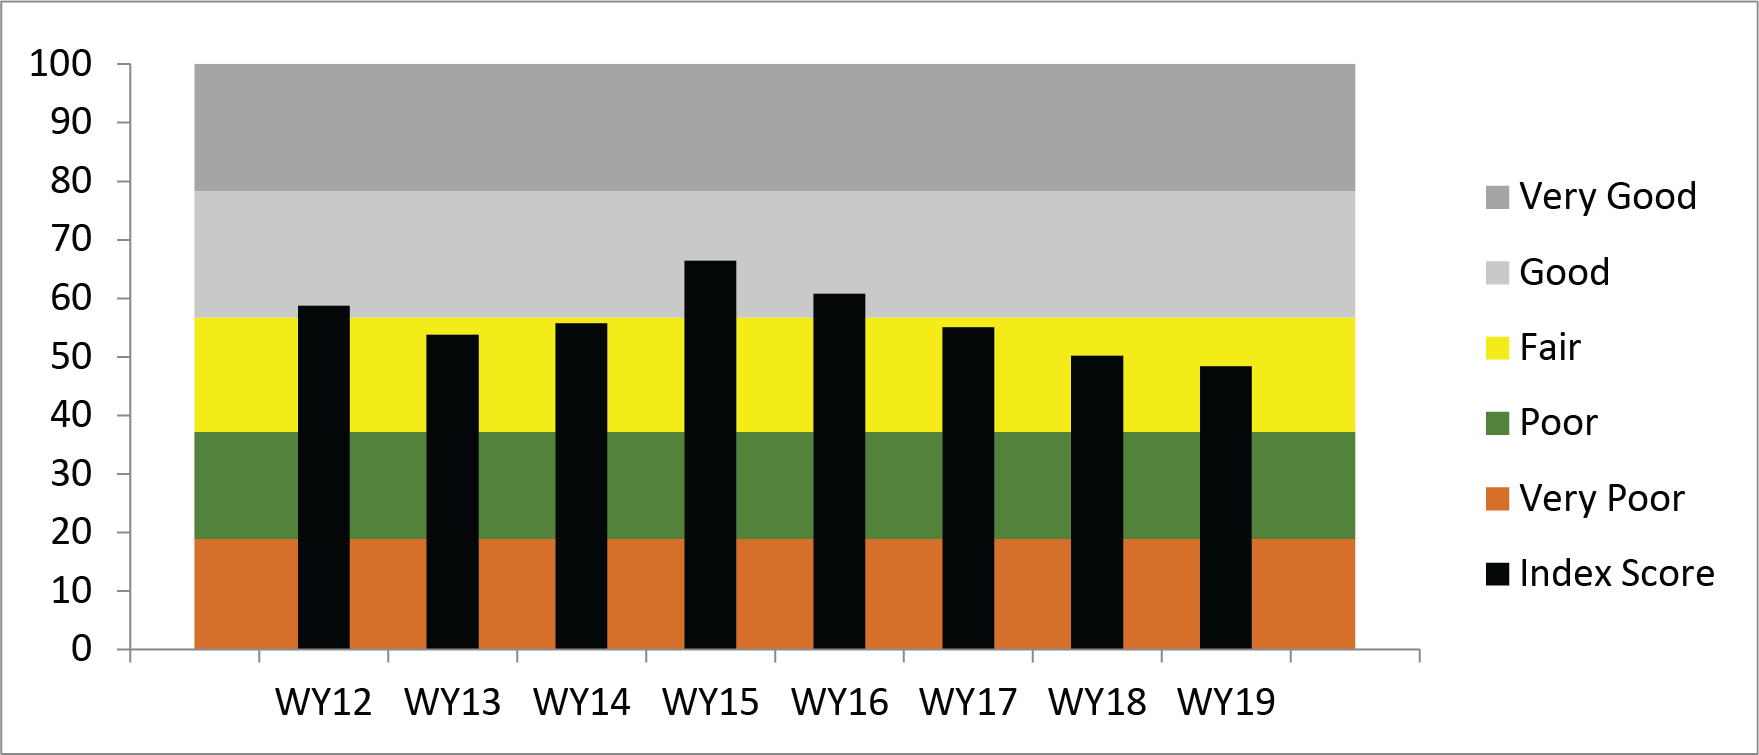 New Mexico Stream Condition Index scores, West Fork Gila River, WY2012–2019.
See Appendices
Appendix 1. Detection limits and methods for nutrient analysis, West Fork Gila River, Gila Cliff Dwellings National Monument, WY2019.
| Analyte | Q1–Q3 High Limit | Q1–Q3 Unit | Q1–Q3 Analysis Method | Q4 High Limit | Q4 Unit | Q4 Method |
|---|---|---|---|---|---|---|
| Alkalinity as CaCO3A | 10 | mg/L | SM 2320B | 10 | mg/L | SM 2320B |
| Aluminum | 0.10 | mg/L | 200.7 | 100 | ug/L | 200.7 Rev 4.4 |
| Ammonia | 0.10 | mg/L | 350.1 | 0.10 | mg/L | 350.1 |
| Anion/Cation Balance | N/A | % | SM 1030E | N/A | % | SM 1030E |
| Antimony | NC | NC | NC | 2.0 | ug/L | 200.8 |
| Arsenic | 0.015 | mg/L | 200.7 | 5.0 | ug/L | 200.8 |
| Barium | NC | NC | NC | 1.0 | ug/L | 200.8 |
| Beryllium | NC | NC | NC | 1.0 | ug/L | 200.8 |
| Bicarbonate Alkalinity as CaCO3A | 10 | mg/L | SM 2320B | 10 | mg/L | SM 2320B |
| Biochemical Oxygen Demand | 2.0 | mg/L | SM5210B | 2.0 | mg/L | SM5210B |
| Boron | 0.10 | mg/L | 200.7 | 0.10 | mg/L | 200.7 Rev 4.4 |
| Cadmium | NC | NC | NC | 1.0 | ug/L | 200.8 |
| Calcium | 0.20 | mg/L | 200.7 | 0.20 | mg/L | 200.7 Rev 4.4 |
| Carbonate Alkalinity as CaCO3A | 10 | mg/L | SM 2320B | 10 | mg/L | SM 2320B |
| Chloride | 3.0 | mg/L | 300.0 | 3.0 | mg/L | 300.0 |
| Chromium | NC | NC | NC | 3.0 | ug/L | 200.8 |
| Copper | 0.015 | mg/L | 200.7 | 2.0 | ug/L | 200.8 |
| Dis Aluminum | 0.10 | mg/L | 200.7 | 100 | ug/L | 200.7 |
| Dis Antimony | NC | NC | NC | 2.0 | ug/L | 200.8 |
| Dis Arsenic | 0.015 | mg/L | 200.7 | 5.0 | ug/L | 200.8 |
| Dis Barium | NC | NC | NC | 1.0 | ug/L | 200.8 |
| Dis Beryllium | NC | NC | NC | 1.0 | ug/L | 200.8 |
| Dis Boron | 0.10 | mg/L | 200.7 | 0.10 | mg/L | 200.7 |
| Dis Cadmium | NC | NC | NC | 1.0 | ug/L | 200.8 |
| Dis Calcium | 0.20 | mg/L | 200.7 | 200 | ug/L | 200.7 |
| Dis Chromium | NC | NC | NC | 3.0 | ug/L | 200.8 |
| Dis Copper | 0.015 | mg/L | 200.7 | 2.0 | ug/L | 200.8 |
| Dis Iron | 0.10 | mg/L | 200.7 | 0.10 | mg/L | 200.7 |
| Dis Lead | 0.0090 | mg/L | 200.7 | 1.0 | ug/L | 200.8 |
| Dis Magnesium | 0.20 | mg/L | 200.7 | 0.20 | mg/L | 200.7 |
| Dis Manganese | 0.010 | mg/L | 200.7 | 2.0 | ug/L | 200.8 |
| Dis Mercury | NC | NC | NC | 0.00020 | mg/L | 245.1 |
| Dis Molybdenum | 0.020 | mg/L | 200.7 | 2.0 | ug/L | 200.8 |
| Dis Nickel | NC | NC | NC | 2.0 | ug/L | 200.8 |
| Dis Phosphorus | 3.0 | mg/L | 200.7 | 3.0 | mg/L | 200.7 |
| Dis Potassium | 3.0 | mg/L | 200.7 | 3.0 | mg/L | 200.7 |
| Dis Selenium | NC | NC | NC | 5.0 | ug/L | 200.8 |
| Dis Silver | NC | NC | NC | 1.0 | ug/L | 200.8 |
| Dis SiO2, Silica | 1.1 | mg/L | 200.7 | 1.1 | mg/L | 200.7 |
| Dis Sodium | 5.0 | mg/L | 200.7 | 5.0 | mg/L | 200.7 |
| Dis Thallium | NC | NC | NC | 1.0 | ug/L | 200.8 |
| Dis Uranium | NC | NC | NC | 1.0 | ug/L | 200.8 |
| Dis Zinc | 0.020 | mg/L | 200.7 | 10 | ug/L | 200.8 |
| Fluoride | 0.50 | mg/L | 300.0 | 0.50 | mg/L | 300.0 |
| Hardness, as CaCO3A | 3.0 | mg/L | SM 2340B | 3.0 | mg/L | SM 2340B |
| Iron | 0.10 | mg/L | 200.7 | 0.10 | mg/L | 200.7 Rev 4.4 |
| Lead | 0.0090 | mg/L | 200.7 | 1.0 | ug/L | 200.8 |
| Magnesium | 0.20 | mg/L | 200.7 | 0.20 | mg/L | 200.7 Rev 4.4 |
| Manganese | 0.010 | mg/L | 200.7 | 2.0 | ug/L | 200.8 |
| Mercury | NC | NC | NC | 0.00020 | mg/L | 245.1 |
| Molybdenum | 0.020 | mg/L | 200.7 | 2.0 | ug/L | 200.8 |
| Nickel | NC | NC | NC | 2.0 | ug/L | 200.8 |
| Nitrate Nitrite as N | 0.10 | mg/L | 353.2 | 0.10 | mg/L | 353.2 |
| Nitrate, Dissolved | 0.50 | mg/L | 300.0 | 0.50 | mg/L | 300.0 |
| Nitrite, dissolved | 0.50 | mg/L | 300.0 | 0.50 | mg/L | 300.0 |
| Nitrogen, Kjeldahl2 | 1.0 | mg/L | 351.2 | 1.0 | mg/L | 351.2 |
| Nitrogen, Total | 0.10 | mg/L | Total Nitrogen | 0.10 | mg/L | Total Nitrogen |
| Phosphorus | 3.0 | mg/L | 200.7 | 3.0 | mg/L | 200.7 Rev 4.4 |
| Potassium | 3.0 | mg/L | 200.7 | 3.0 | mg/L | 200.7 Rev 4.4 |
| Selenium | NC | NC | NC | 5.0 | ug/L | 200.8 |
| Silver | NC | NC | NC | 1.0 | ug/L | 200.8 |
| SiO2, Silica | 1.1 | mg/L | 200.7 | 1.1 | mg/L | 200.7 Rev 4.4 |
| Sodium | 5.0 | mg/L | 200.7 | 5.0 | mg/L | 200.7 Rev 4.4 |
| Sulfate | 5.0 | mg/L | 300.0 | 5.0 | mg/L | 300.0 |
| Thallium | NC | NC | NC | 1.0 | ug/L | 200.8 |
| total dissolved solids | 10 | mg/L | SM 2540C | 10 | mg/L | SM 2540C |
| Total Organic Carbon | NC | NC | NC | 1.0 | mg/L | SM 5310B |
| Total Suspended Solids | 4.0 | mg/L | SM 2540D | 4.0 | mg/L | SM 2540D |
| Uranium | NC | NC | NC | 1.0 | ug/L | 200.8 |
| Zinc | 0.020 | mg/L | 200.7 | 10 | ug/L | 200.8 |
BReporting limit for Q1 was 0.20 mg/L
N/A = Not Applicable
NC = Not collected
Appendix 2. Macroinvertebrate taxa collected at the index reach on the West Fork of the Gila River, Gila Cliff Dwellings NM, WY19.
| Phylum | Class | Order | Family | Genus | Species |
|---|---|---|---|---|---|
| Annelida | Oligochaeta | ||||
| Arthropoda | Arachnida | Trombidiformes | Hydryphantidae | Protzia | |
| Arthropoda | Arachnida | Trombidiformes | Hygrobatidae | ||
| Arthropoda | Arachnida | Trombidiformes | Lebertiidae | Lebertia | |
| Arthropoda | Arachnida | Trombidiformes | Torrenticolidae | Torrenticola | |
| Arthropoda | Arachnida | Trombidiformes | |||
| Arthropoda | Arachnida | Trombidiformes | Mideopsidae | Mideopsis | |
| Arthropoda | Arachnida | Trombidiformes | Sperchontidae | Sperchon | |
| Arthropoda | Arachnida | Trombidiformes | Sperchontidae | Sperchonopsis | |
| Arthropoda | Insecta | Coleoptera | Dryopidae | Helichus | |
| Arthropoda | Insecta | Coleoptera | Dryopidae | Postelichus | |
| Arthropoda | Insecta | Coleoptera | Dytiscidae | ||
| Arthropoda | Insecta | Coleoptera | Elmidae | Dubiraphia | |
| Arthropoda | Insecta | Coleoptera | Elmidae | Microcylloepus | pusillus |
| Arthropoda | Insecta | Coleoptera | Elmidae | Optioservus | quadrimaculatus |
| Arthropoda | Insecta | Coleoptera | Elmidae | Optioservus | |
| Arthropoda | Insecta | Coleoptera | Elmidae | ||
| Arthropoda | Insecta | Coleoptera | Haliplidae | Peltodytes | |
| Arthropoda | Insecta | Coleoptera | Psephenidae | Psephenus | |
| Arthropoda | Insecta | Diptera | Ceratopogonidae | Atrichopogon | |
| Arthropoda | Insecta | Diptera | Chironomidae | ||
| Arthropoda | Insecta | Diptera | Dixidae | Dixella | |
| Arthropoda | Insecta | Diptera | Empididae | Hemerodromia | |
| Arthropoda | Insecta | Diptera | Empididae | Neoplasta | |
| Arthropoda | Insecta | Diptera | Simuliidae | Simulium | |
| Arthropoda | Insecta | Diptera | Stratiomyidae | ||
| Arthropoda | Insecta | Diptera | Tabanidae | Tabanus | |
| Arthropoda | Insecta | Diptera | Tipulidae | Tipula | |
| Arthropoda | Insecta | Ephemeroptera | Baetidae | Acentrella | |
| Arthropoda | Insecta | Ephemeroptera | Baetidae | Baetis | |
| Arthropoda | Insecta | Ephemeroptera | Baetidae | Callibaetis | |
| Arthropoda | Insecta | Ephemeroptera | Baetidae | Centroptilum | |
| Arthropoda | Insecta | Ephemeroptera | Ephemerellidae | ||
| Arthropoda | Insecta | Ephemeroptera | Heptageniidae | Epeorus | |
| Arthropoda | Insecta | Ephemeroptera | Leptohyphidae | Leptohyphes | |
| Arthropoda | Insecta | Ephemeroptera | Leptohyphidae | Tricorythodes | |
| Arthropoda | Insecta | Ephemeroptera | Leptohyphidae | ||
| Arthropoda | Insecta | Hemiptera | Belostomatidae | Abedus | |
| Arthropoda | Insecta | Hemiptera | Belostomatidae | ||
| Arthropoda | Insecta | Hemiptera | Corixidae | Trichocorixa | |
| Arthropoda | Insecta | Hemiptera | Corixidae | ||
| Arthropoda | Insecta | Hemiptera | Naucoridae | Ambrysus | |
| Arthropoda | Insecta | Hemiptera | Veliidae | Microvelia | |
| Arthropoda | Insecta | Lepidoptera | Crambidae | Petrophila | |
| Arthropoda | Insecta | Megaloptera | Corydalidae | Corydalus | cornutus |
| Arthropoda | Insecta | Odonata | Calopterygidae | Hetaerina | |
| Arthropoda | Insecta | Odonata | Coenagrionidae | Argia | |
| Arthropoda | Insecta | Odonata | Coenagrionidae | ||
| Arthropoda | Insecta | Odonata | Gomphidae | ||
| Arthropoda | Insecta | Trichoptera | Calamoceratidae | Phylloicus | aeneus |
| Arthropoda | Insecta | Trichoptera | Helicopsychidae | Helicopsyche | |
| Arthropoda | Insecta | Trichoptera | Hydropsychidae | Cheumatopsyche | |
| Arthropoda | Insecta | Trichoptera | Hydropsychidae | Hydropsyche | |
| Arthropoda | Insecta | Trichoptera | Hydropsychidae | ||
| Arthropoda | Insecta | Trichoptera | Hydroptilidae | Hydroptila | |
| Arthropoda | Insecta | Trichoptera | Hydroptilidae | Leucotrichia | |
| Arthropoda | Insecta | Trichoptera | Hydroptilidae | Ochrotrichia | |
| Arthropoda | Insecta | Trichoptera | Lepidostomatidae | Lepidostoma | |
| Arthropoda | Insecta | Trichoptera | Leptoceridae | Nectopsyche | |
| Arthropoda | Insecta | Trichoptera | Leptoceridae | ||
| Arthropoda | Insecta | Trichoptera | Limnephilidae | ||
| Arthropoda | Insecta | Trichoptera | Philopotamidae | Chimarra | |
| Arthropoda | Insecta | Trichoptera | Polycentropodidae | Polycentropus | |
| Arthropoda | Insecta | Trichoptera | Psychomyiidae | Psychomyia | |
| Mollusca | Gastropoda | Basommatophora | Physidae | Physa |
See Literature Cited
Eaton, A. D., L. S. Clesceri, E. W. Rice, and A. E. Greenberg, eds. 2005. Standard methods for the examination of water and wastewater. 21st edition. American Public Health Association, American Water Works Association, Water Environment Federation, American Public Health Association, Washington, D.C.
Jacobi G. Z., M. D. Jacobi, M. T. Barbour, and E. W. Leppo. 2006. Benthic macroinvertebrate stream condition indices for New Mexico wadeable streams. Jacobi and Associates and Tetra Tech, Inc. for New Mexico Environment Department, Surface Water Quality Bureau. Santa Fe, New Mexico.
National Park Service (NPS). 1998. Baseline water quality data inventory and analysis: Gila Cliff Dwellings National Monument. NPS/NRWRD/ NRTR-98/156. National Park Service, Water Resources Division. Fort Collins, Colorado.
New Mexico Administrative Code (NMAC). 2013. Environmental water quality standards of interstate and intrastate surface waters. Page 48 in New Mexico Water Control Commission, Title 20, Chapter 6, Part 4. http://164.64.110.239/ nmac/parts/title20/20.006.0004.pdf. Accessed April 11, 2016.
References
Information on background and methods was summarized from E. L. Gwilliam, L. Palacios, and K. Raymond, Status of climate and water resources at Gila Cliff Dwellings National Monument: Water year 2018.
