Part of a series of articles titled Alaska Park Science, Volume 18, Issue 1, Understanding and Preparing for Alaska's Geohazards.
Article
Spring Breakup on the Yukon: What Happens When the Ice Stops

Photo courtesy of Scott Lindsey, National Weather Service
May 4, 2009 - I landed in Eagle, Alaska with Claude Denver from the State of Alaska Division of Homeland Security and Emergency Management and we discovered that the Yukon River ice downstream of town had jammed and Eagle was flooding. One local resident said it was the worst flood since 1937. That same day, upstream at Dawson, a run of ice and water passed town and caused water levels there to rise 8 feet (2.5 m). What was already a significant flood in Eagle became a full-fledged disaster that night as water levels rose an additional 10 feet (3 m) and ice chunks the size of bulldozers started to move ashore and crush people’s homes.
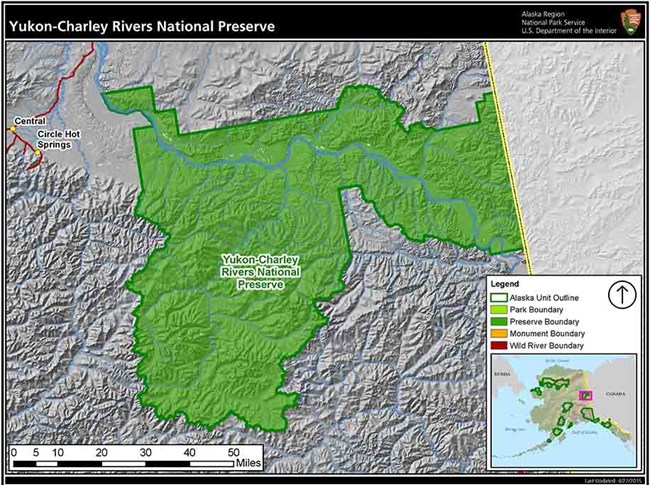
The mighty Yukon River enters the United States just upstream of Eagle, Alaska and proceeds to wind to the northwest through the Yukon-Charley Rivers National Preserve (Figure 1). It passes the villages of Circle and Fort Yukon before turning southwest and heading for the Bering Sea. A traveler would cover about 1,200 miles (1,930 km) of Alaskan wilderness following the river from the border to the mouth. During the summer, residents and visitors use the river as a highway connecting villages and allowing access to subsistence resources and to remote parts of the state by boat. The winter months bring a solid ice cover often exceeding 5 feet (1.5 m) in depth, and with a good snow cover, the river becomes a gateway to everywhere that can be accessed by snow machine, dog sled, or for the truly hearty souls, snowshoes or skis.
The transition seasons interrupt that access as the rivers freeze up in the fall and breakup in the spring. Spring breakup can bring catastrophic floods as the water levels rise and the ice moves, and sometimes jams and stops. During a typical winter in interior Alaska, snow accumulates from October to April and temperatures as low as -60°F keep the snowpack building in depth and water content until April. As the day length starts to rapidly increase in April and May, temperatures rise above freezing, snow begins to melt, and at some point, the river ice begins to move. How it moves downstream determines whether folks living along the river breathe a sigh of relief or throw necessities together, pack up their most precious possessions and quickly move to higher ground.
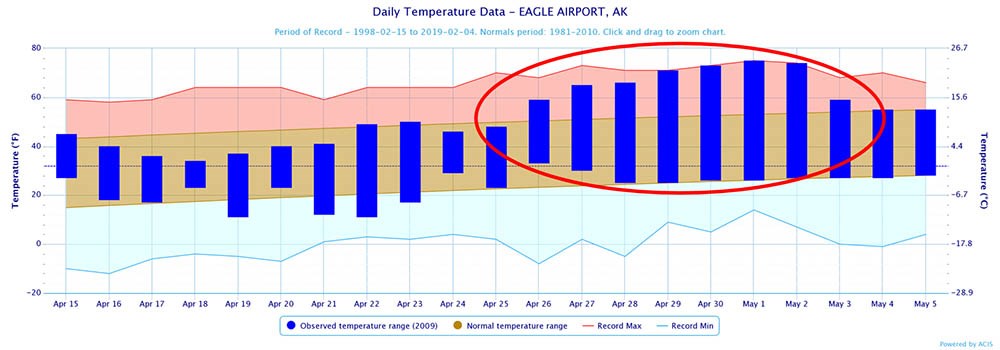
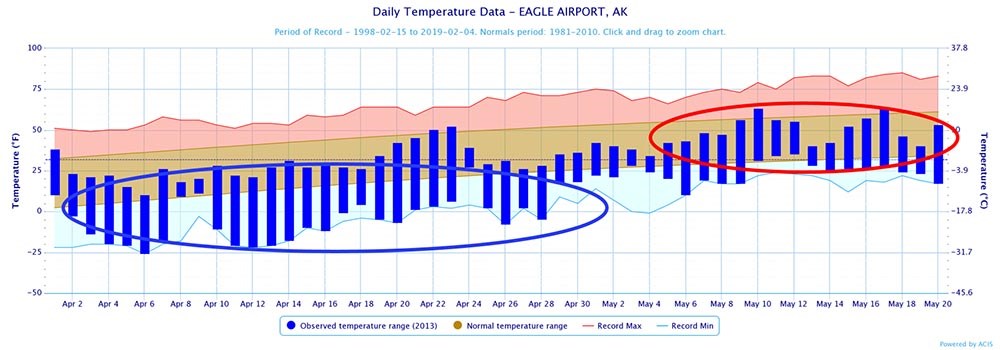
Several factors affect the timing and severity of breakup. Ice thickness and snowpack impact when breakup occurs and the likelihood that ice jams will occur. Temperature typically decreases as elevation increases, so freezing levels determine what proportion of the watershed will contribute snowmelt runoff into the river (e.g., a freezing level at 5,000 ft [1,500 m] means everything below that has a temperature above freezing). Early season rainfall, although rare, can push a significant amount of rainfall runoff into the river. Ice that has a fresh layer of snow with a high albedo (albedo is a measure of how much of the sun’s energy is reflected rather than absorbed), may be much stronger than ice that is bare of snowcover and has been exposed to the sunshine for days. The level of the river when the ice formed in the fall can also affect the severity of breakup. When rivers freeze at high water levels, ice sheets will extend over the great majority of the river channel, which can translate into ice sheets that don’t fracture easily when increased runoff starts to lift them and push them downstream. But the most important factor governing timing and severity of breakup is the temperature pattern from early April to mid-May (Figure 2).
When temperatures begin to rise above freezing and reports of open water and lifted ice on river edges and in river channels begin to arrive at the Alaska-Pacific River Forecast Center (APRFC), it is time to coordinate a launch of a Riverwatch team with the State of Alaska Division of Homeland Security and Emergency Management (DHS&EM). Riverwatch is a collaborative program between DHS&EM and the National Weather Service (NWS) APRFC to monitor the river ice breakup and to assist communities in the event of breakup related flooding. The program, in existence since the 1970s, teams a hydrologist from APRFC with an Emergency Management specialist from DHS&EM in a small, chartered plane. During these flights, the Riverwatch team flies along the river observing ice and breakup conditions and reports pertinent information to the NWS, state officials, and most importantly, residents of the villages and towns along the Kuskokwim and Yukon rivers. The hydrologist determines the potential for flooding, including likely severity, and the team lands in each village or town and talks to community leaders to share their observations of the river, advise them of potential flood threats and ensure that they are properly prepared. NWS Weather Forecast offices disseminate watches and warnings for hazards including flooding from breakup ice jams. When severe flooding occurs that overwhelms the resources of a community, the state’s DHS&EM and, in some cases, the federal government through the Federal Emergency Management Agency (FEMA), coordinate the management of various local, state, federal, and tribal efforts to bring relief to the community. The main purpose of Riverwatch is to keep residents informed of potential threats, let them know where the breakup front is located relative to their town or village, ensure that communities are prepared for potential flooding, and facilitate responses when flooding occurs. In 2009, when flooding began, the state had up-to-date information on the status of Eagle and relief efforts were launched quickly as the need for help became apparent.
Some examples will better explain how breakup factors interrelate and how they can lead to very different outcomes. There are two basic types of breakup processes (Beltaos 2009). The first is called a thermal breakup or colloquially, a mushout. Various combinations of circumstances can contribute to a thermal breakup. Essentially, ice gets soft and weak before any significant amount of water and ice from upstream arrives to push it. When water levels rise or a local ice run from a tributary reaches that ice, it quickly breaks into very small pieces. A slow transition from cold temperatures to warm temperatures is probably the primary contributor to this type of breakup, but a low snowpack can also lead to a reduction in snowmelt runoff that allows river ice to melt and deteriorate in place. When thermal breakups occur, breakup may begin at a number of different locations on the river, often at nearly the same time, and the ice tends to break up into small pans and chunks and most important, ice jams that persist for a significant length of time are unlikely to form.
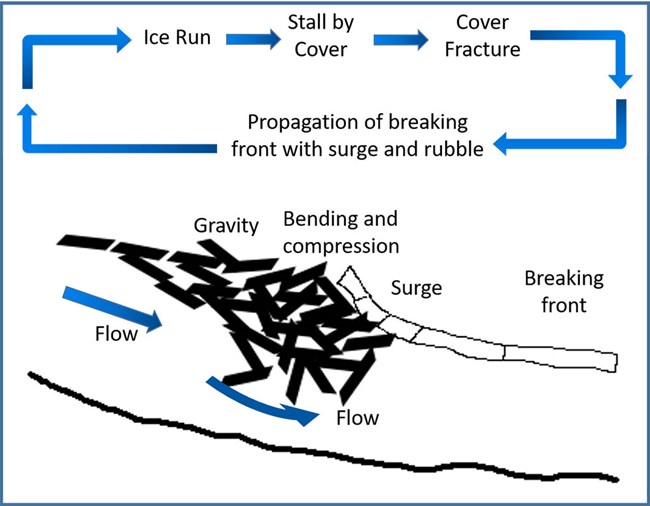
The second scenario is often referred to as a dynamic or mechanical breakup. Typically, this occurs when there is normal to above-normal snowpack and significant ice thickness. When there is a sudden transition from temperatures near freezing to climatological averages or above (interior Alaska temperatures can reach the 60s and 70s in May), a surge of snowmelt enters the river while the ice is still hard and intact, often with a high albedo reflecting much of the sun’s energy. Sheets of ice a half mile or more wide and several miles long first float and then start to move as water levels rise (Figure 3). Any type of channel constriction or sharp bend then results in the downstream ice edge being shoved with considerable force either up onto higher ground or sand bars, or downward into the river bottom. Both options result in a severe restriction of flow through that jam point and water upstream can rise very rapidly.
In 2009, the water level in Eagle rose more than 30 feet (9 m) in 48 hours as a result of an ice jam 10 miles (16 km) downstream. When a jam of this magnitude occurs, a huge volume of ice and water accumulates and when the jam releases, that ice moves downstream until it reaches the next area of solid ice or some type of channel constriction or tight bend. Then the whole cycle repeats. Dynamic breakups tend to march from upstream to downstream and flood multiple areas and communities as it encounters river ice that is not yet ready to move. In 2009, communities on the Yukon River downstream of Eagle including Circle, Stevens Village, and Tanana also experienced major flooding as the breakup front stalled repeatedly while progressing downstream.
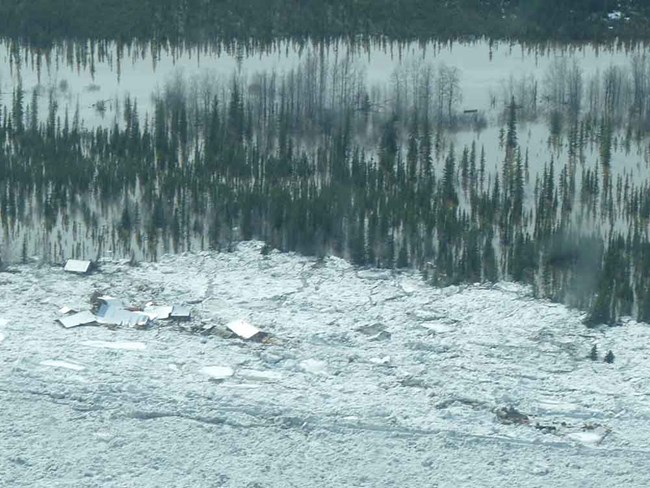
Photo courtesy of Scott Lindsey, National Weather Service
In addition to the hazard of major flooding, the ice itself can create dangerous situations. Large sheets of ice can be shoved up onto riverbanks and islands and can level everything in the way. An island just in front of Eagle had a mature stand of trees before the 2009 flooding and after the ice went out, the island was barren. Just a short distance upstream of Eagle in Eagle Village, homes and buildings near the river experienced the same treatment and after the ice in the river moved out and the massive chunks of ice stranded on the riverbank melted, there was little evidence of anything left in Eagle Village. Bank erosion can also be accelerated to an extreme level as sheets, pans, and chunks of ice are shoved out of the channel or just move downstream at a fast rate.
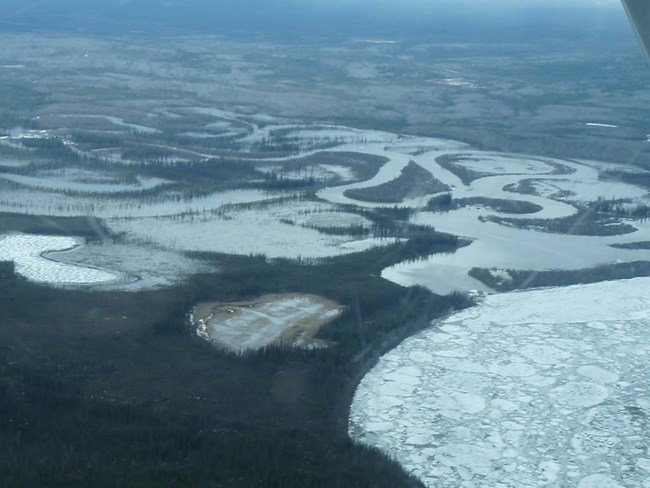
Photo courtesy of Scott Lindsey, National Weather Service
Another type of flooding that occurs during spring breakup involves tributaries or smaller streams that enter the main river. When levels on the mainstem, in this case the Yukon River, are very high, water entering from smaller streams tends to back upstream in what is referred to as backwater. The level of the ice and water in the mainstem prevent normal flow from the tributary into the mainstem and water starts to back up and rise on the tributary until it reaches the same or greater height as the water and ice at the confluence with the mainstem. This can cause flooding on the tributary far upstream of the confluence with the mainstem river.
After the extreme flooding in 2009, it was four years before Eagle saw another significant ice jam flood. In 2013, temperatures around the state were very cool during the month of April and temperature outlooks from the National Oceanic and Atmospheric Administration’s (NOAA) Climate Prediction Center showed that trend continuing through mid-May. Although April 1 is typically the date when snowpacks in Alaska reach their peak water equivalent, in 2013 snow kept accumulating in some parts of the interior right through the middle of May. Temperatures then began a quick rise toward normal values (Figure 4), river levels started to rise, but the ice was not ready to move yet. Just a week of temperatures with lows near freezing, highs near normal, and freezing levels near 5,000 feet (1,500 m) was enough to jump start another dynamic breakup. Claude Denver and I were staying in a bed and breakfast right on the bank of the river when ice started moving just after midnight on May 17th. By 3 am, the ice had stopped moving and less than an hour later there was 3 ft (1 m) of water in the ground floor of the building we were staying in. Eagle ended up with water levels at 43.9 feet (13 m) or almost 10 feet (3 m) above flood stage for the second-highest flood on record (but well below the 55.7 feet [17 m] level of 2009). In true dynamic breakup fashion, Circle saw moderate flooding, Fort Yukon experienced some minor flooding, and the town of Galena downstream of the confluence with the Tanana River experienced catastrophic flooding.
The first recorded breakup at Eagle occurred on May 10, 1898 and the breakup date has been documented most years since that time. The U.S. Army Corps of Engineers has an ice jam database showing locations and dates of river ice jams around the country. The APRFC is located in Anchorage, Alaska and in addition to the Riverwatch program for the Yukon and Kuskokwim rivers, provides detailed information, forecasts, and flood warnings for rivers in the state. In the years since 2013, breakup has been quiet on the upper Yukon River. Generally, spring temperatures have warmed up slowly and uniformly, causing snowmelt to enter the river at a pace that has not created any large waves of runoff moving downstream. Ice has slowly melted and weakened, and although the timing has been different each year (many villages experienced their earliest breakup on record in 2016), the result has been the same, a thermal breakup and no flooding. But there will be another year, maybe in the near future, when snow and ice conditions are right and we have a rapid transition from winter to spring, and the ice will stop.
References
Alaska-Pacific River Forecast Center Breakup Map
Beltaos, S., ed. 2009.
River Ice Breakup. Water Resources Publications, LLC. Highlands Ranch, CO. p. 53, 201-202.
Shen, H. T. and L. Liu. 2003.
Shokotsu River ice jam formation. Cold Regions Science and Technology 37(1):35-49.
Last updated: October 26, 2021
