Last updated: January 6, 2020
Article
Forest Health in a Regional Context
How Are Our Forests Doing?
Understanding the condition of park natural resources is essential to making informed management decisions. However, when looking at raw data or statistics, it is hard to evaluate what those numbers tell us about park resources. For example, “Is 9,000 tree seedlings per hectare enough for the park’s forests to regenerate?” or “How bad is the exotic invasive species problem in this park?”

NPS
Putting raw data into context provides insight on how park resources are doing. Analyzing and comparing data from numerous parks lets managers assess how the forest condition at their parks compares to other parks in the region.
What We Are Doing
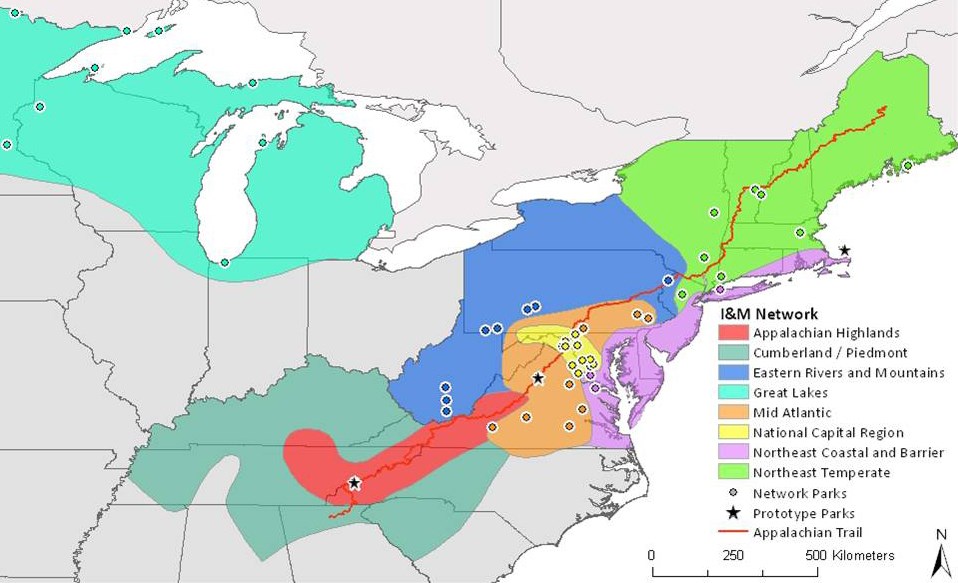
Eight Inventory and Monitoring (I&M) networks have been collaborating on forest health monitoring since 2005. Participants include 61 national parks (23% of all parks in the I&M Program) in the eastern United States (Figure 1). As a result of this collaboration, vegetation data are collected in similar ways, which allows us to compare various parks across the region.

NPS / K. Miller
Two examples of regional analyses that resulted from this collaboration are discussed below.
What We Are Finding
Exotic Invasive Plants
Exotic invasive plants pose a serious threat to many parks’ forests because they can outcompete native plants, suppress forest regeneration, degrade wildlife habitat, and affect soil fertility.
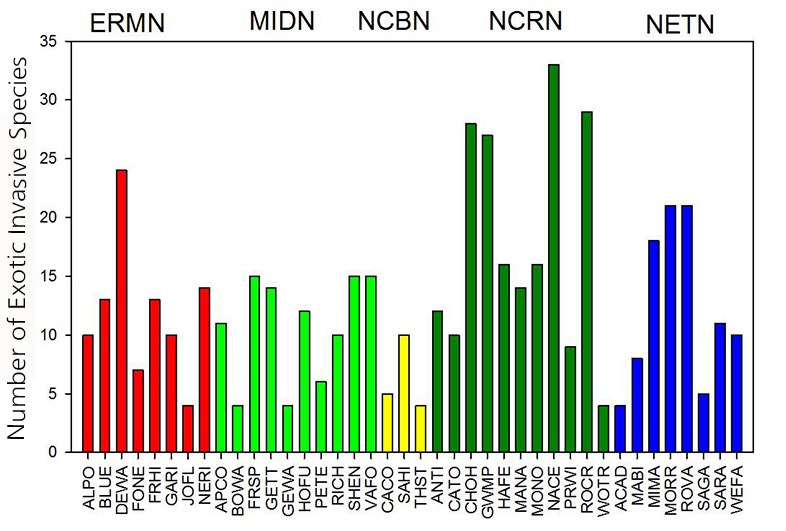
The diversity and distribution of exotic invasive plants varies among Eastern Rivers and Mountains Network (ERMN) parks and other parks in the region (Figures 2 and 3). Some important comparisons include:
- Delaware Water Gap National Recreation Area (DEWA) forests contain more species of exotic invasive plants than most other parks in the region.
- Relatively few species of exotic invasive plants have been detected in forests at Johnstown Flood National Memorial (JOFL).

NPS / J.P. Schmit
- Nearly all forest monitoring plots in Friendship Hill National Historical Site (FRHI) contain at least one exotic invasive plant species.
- Gauley River National Recreation Area (GARI) contains a lower percentage of plots with exotic invasive species than most other parks in the region.

NPS / J.P. Schmit

NPS / S. Murphy
Forest Regeneration
The number of tree seedlings present on the forest floor is an important indicator of whether the forest can renew itself as older trees die. Seedling density in forest monitoring plots varies greatly among parks (Figure 4). In general, ERMN parks contain moderate densities of tree seedlings compared to other parks in the region. Friendship Hill National Historic Site, however, ranks in the lower 20th percentile of regional parks. None of the ERMN parks contain 14,000 seedlings / hectare, a target seedling density suggested by the U.S. Forest Service for forests with low deer browse pressure.
In ERMN parks, tree regeneration is strongly influenced by elevation, fern cover, grass cover, and number of stems of indicator plants sensitive to deer browse. In general, forests at higher elevation contain more regeneration. At sites with greater than 20% fern cover, tree regeneration decreases with greater fern cover. Similarly, as the cover of grasses increases, the amount of tree regeneration decreases. Sites with greater numbers of stems of herbaceous plants sensitive to deer browse contain more tree regeneration.

NPS / S. Perles
For More Information
Stephanie Perles
Ecologist, Project Lead
Forest Vegetation & Soils Monitoring
814-441-9643
stephanie_perles@nps.gov
Eastern Rivers & Mountains Network
420 Forest Resources Building
University Park, PA 16802
Summary by the Eastern Rivers & Mountains Network, April 2011.
Tags
- allegheny portage railroad national historic site
- bluestone national scenic river
- delaware water gap national recreation area
- fort necessity national battlefield
- friendship hill national historic site
- gauley river national recreation area
- johnstown flood national memorial
- new river gorge national park & preserve
- im
- ermn
- east coast
- vital sign
- monitoring
- vegetation
- forests
- forest health
- regeneration
- forest regeneration
- invasive species
- plants
- invasive plants
- natural resources
