Last updated: December 26, 2019
Article
Documenting the Toll of Coastal Storms — with Smartphones

NPS/Daley
If you see National Park Service (NPS) employees wandering around Fire Island National Seashore after a storm staring at their phones, you’d be forgiven for thinking they’re taking selfies for their next Instagram post. But the more likely answer is that they’re using a different “app” — one used for documenting the impacts of storms in national parks.
While safety is the first priority after a storm, data collection is an immediate second. NPS dispatches Resource Advisors, or READs, to survey park sites and collect post-storm data, such as damage to park structures and the extent of storm surges and flooding.

GeoSpatial Insights
“We use what is easiest for the user,” explains Richard Schwab, NPS National Post-Fire Programs Coordinator. “Especially for data collection, some of these folks, they’re coming into an incident and this may be the only time they’re going to use a tool like that.”
Data collection of this kind is important because it helps NPS better understand how storms affect park infrastructure and natural resources, which aids future construction, maintenance, and management planning. For example, if READs can identify the buildings within a given park that are most prone to flooding from storm surges, those buildings can be preemptively fortified with sandbags before the next storm, or reconstructed in ways that prevent future damage.

NPS/Budzinski
“It’s not a question of if there’s going to be another hurricane but a question of when it’s going to happen, and the National Park Service needs to be prepared for that,” warned Roland Duhaime, a research associate at the University of Rhode Island’s Environmental Data Center, which provides geographic information system (GIS) services and support to NPS parks and offices throughout the Northeast Region.
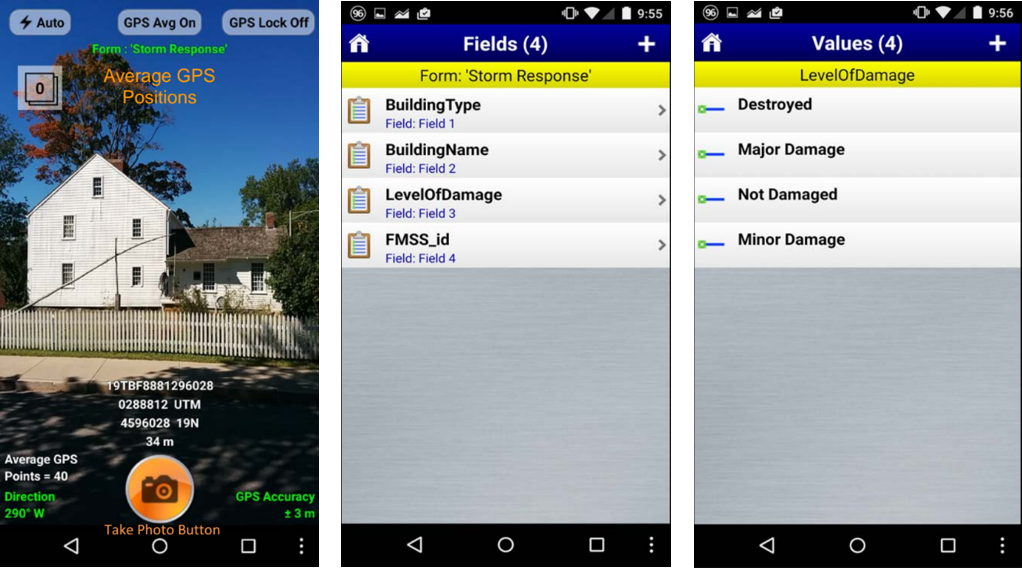
GeoJot and ArcGIS Online have several advantages over manual data collection. Most importantly, they can be used on a smartphone, which most people already have in their pockets at all times. Smartphones and tablets are relatively inexpensive compared to special GPS cameras and related technologies. Because the application stores the geographical coordinates, forms, and other information within the photo file, the photo and associated data are never separated, eliminating the possibility of data mix-ups and mismatches. Some data, such as the geographic coordinates, are recorded automatically, eliminating the possibility of human error and saving time. The applications’ forms are easy to understand, intuitive to use, and can be standardized by the administrator, allowing them to require certain attributes be filled in before submission.

NPS
According to Schwab, one of the applications’ most useful features is the ability to create detailed maps. Using the applications’ software, park staff can gather data from READs and embed them on an interactive map, allowing them to view photos and data from around the park quickly and easily.
“It’s a tremendous help,” he said. “That type of intel is critical.”

NPS/Duhaime
Sea level rise monitoring
Another way NPS uses these smartphone applications—coupled with survey-grade GPS receivers— is for documenting the elevation above sea level of park structures in coastal parks. This data will help NPS plan for sea level rise caused by climate change.
“It’s very much geared towards adaptation,” said Brian Diethorn, NPS Facility Management GIS Data Manager, who manages the park service’s GeoJot subscription and helped with the elevation mapping project.
Diethorn worked with the NPS Sustainable Operations and Climate Change (SOCC) branch on the research project. By identifying park structures at risk of inundation from sea level rise, SOCC hopes to develop tools to help park managers make informed decisions about new construction, repairs, and rehabilitation projects.
NPS worked with researchers from Western Carolina University to study how coastal park assets could be affected by projected sea level rise. The study found that more than one-third of the assets surveyed are at risk from long-term sea level rise — assets valued at over $40 billion.
Written by: Paul McDivitt, Megan Skrip, Jamie Remillard, and Caroline Gottschalk Druschke (SEAcomm URI)
