Last updated: June 8, 2023
Article
Measuring the Effects of Rainstorm Intensity on Adobe Walls in the National Parks

In the national parks, discussion of climate change often centers around its effects on natural resources. But climate change also poses serious problems for cultural resources. An interdisciplinary experiment at the Desert Research Learning Center sought to help park managers understand the possible effects of climate change on historic adobe structures.
Background
In 2010, following an intense early-winter rainfall, a hole developed around the west sanctuary window of the >200-year-old adobe church of San Jose de Tumacácori, one of the primary resources of Tumacácori National Historical Park (NHP). Nearly a ton of adobe and two lintels were lost. After that year’s summer monsoon, a large portion of the north wall of the sacristy collapsed. In 2015, a fireplace collapsed following an intense and unusually timed autumn rainfall. And in 2018, the Mission Church of San Jose de Tumacácori suffered partial collapses of two exterior walls (losses of 46 and 4 cubic feet, respectively) after the park received 1.5 inches of February rain in 24 hours (Lim 2019).
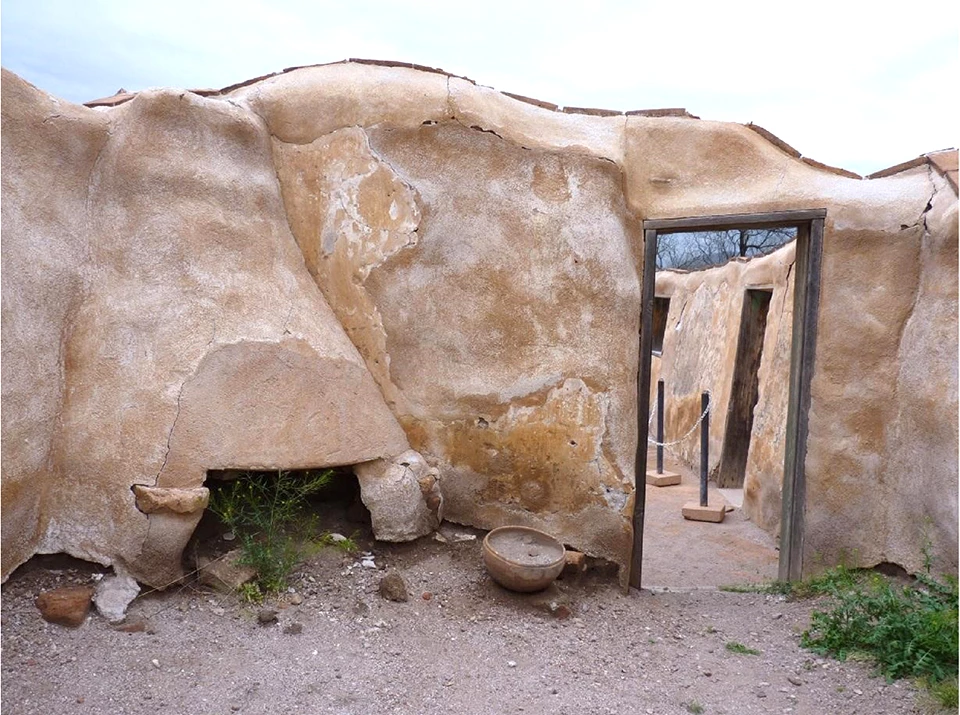
Left image
Fireplace in convento at Tumacácori National Historical Park in March 2015
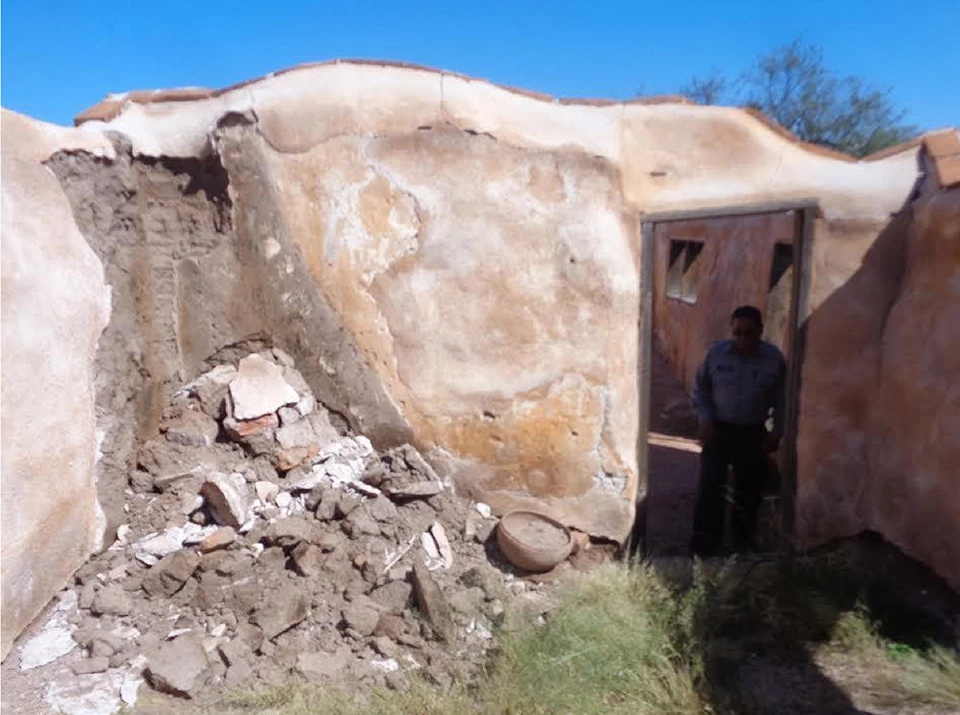
Right image
Fireplace in convento at Tumacácori National Historical Park in October 2015, after the park received 3.62” of rain in four days.
There hasn’t been enough long-term environmental monitoring of cultural resources to say for sure that the damage at Tumacácori was the result of climate change—and other variables, such as preservation treatment histories, building condition, and building materials, would also need to be accounted for. But from 2003 to 2012, mean annual temperatures at the park exceeded more than 90% of mean annual temperatures from the preceding century. (Additional information on temperature and precipitation at the park can be obtained from the Sonoran Desert Network.) Climate projections for the Southwest predict increased temperatures and decreased precipitation overall. But high-intensity rainfall events are expected to increase. So is variability; that is, the potential for heavy rainfall events at times of the year when they previously didn’t happen.
To help park managers prevent similar damage in the future, cultural resource staff are working with climate scientists and historic-preservation experts to understand how changing climates could accelerate the breakdown of historic materials. At the Desert Research Learning Center, National Park Service (NPS) staff and volunteers built walls of adobe bricks, then simulated rainstorms to see how they would stand up to rainshowers of different intensities.
The project brought together experts from across disciplines—and technology from across millennia. First, archeologists, masons, and historic preservationists taught a small army of staff and volunteers the skills they needed to create adobe bricks and fashion them into walls. Adobe—derived from the Arabic “aṭ-ṭūb” (“the bricks”)—is one of humanity’s oldest building materials. Fast-forward several thousand years and, with the help of hydrologists, soil scientists, geographers, climate data, and computers, the walls were subjected to 30-minute rain simulations at different intensities based on 1-year, 25-year, and 100-year historical rain events at the park.

Building the Walls
Before the experiment could start, we needed bricks—lots of bricks.
Under a blazing Arizona sun, historic-preservation experts from the NPS, US Forest Service, and Bureau of Land Management taught project participants to mix adobe bricks and pour them into forms to dry and cure for at least four weeks. After that, a few bricks were split open to ensure they were dry inside. The bricks, made of sand, clay, and silt, were sourced from a local materials center, and tested by Tumacácori NHP staff to ensure they were similar to materials used at the park.
With expert guidance, we used the 800(!) dried bricks to build 20 adobe walls, each 31” wide, 40” tall, and 16” deep. Mortar was made from the same materials as the bricks, with the clay sifted on 1/4" mesh screens to form a finer substrate.

Each wall included two special bricks, placed at specific, consistent locations. One brick contained a soil-moisture sensor; the other, a soil water potential sensor. The soil-moisture sensor measured volumetric water content—the amount of moisture in the brick. Soil water potential indicates the force by which water is retained in or transported from soil to other materials; its sensor was intended to provide a measure of how easily the bricks would dry out after the rain.
After the walls were built, the LiDAR experts took over. Each wall was laser-scanned to sub-centimeter accuracy. This provided a 3-D model of each wall prior to the rain simulations.

Making it Rain
To simulate showers, staff from the USDA Agricultural Research Service designed and built a portable rain tent from a water nozzle affixed to an oscillating arm (like a lawn sprinkler), set above the wall and fed by a tub filled with water. A computer controlled the sprinkler, telling it how often to spray to simulate one of three intensities representing rain events based on historical climate data for Tumacácori NHP.
The 20 adobe walls were divided into four sets of five walls each. Three sets were each assigned to a different rainshower intensity. A fourth set of walls, used as a control, was left untreated. The rain tent was moved from wall to wall, simulating a 30-minute shower at each one.
| Return interval | Intensity (in/hr) | Total precipitation (in) |
|---|---|---|
| 1-year event | 1.42 | 0.71 |
| 25-year event | 3.34 | 1.67 |
| 100-year event | 4.18 | 2.09 |
The requested video is no longer available.
Results by the Numbers
Within a week of the first rain simulation (and in the absence of any rain or other natural environmental influences that might have skewed the results), each wall was laser-scanned again. By comparing the before-and-after images, we calculated the amounts of material loss, maximum cavity depth (maximum horizontal depth of the largest cavity from the original wall face), and affected surface area for each wall.
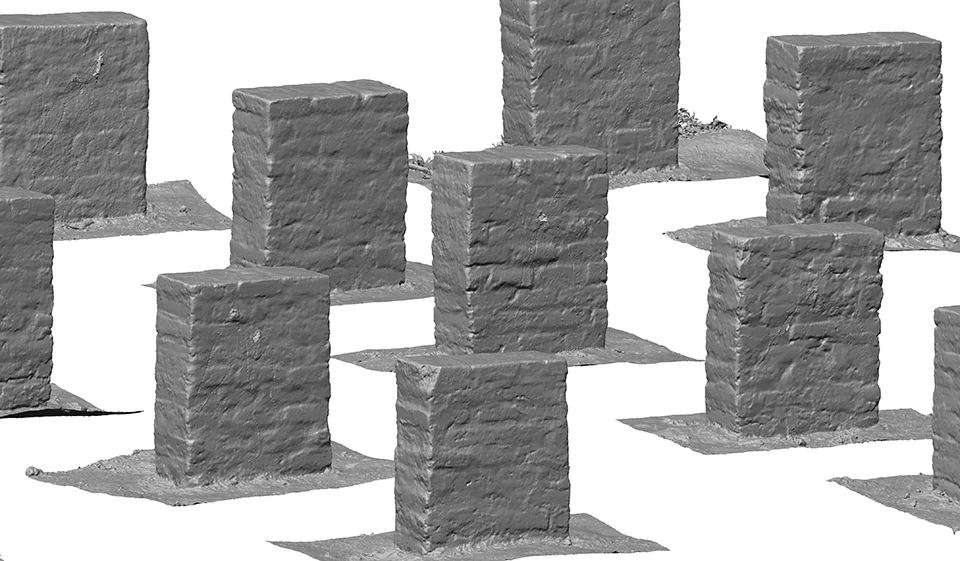
Left image
LiDAR imagery of adobe walls before rain simulation
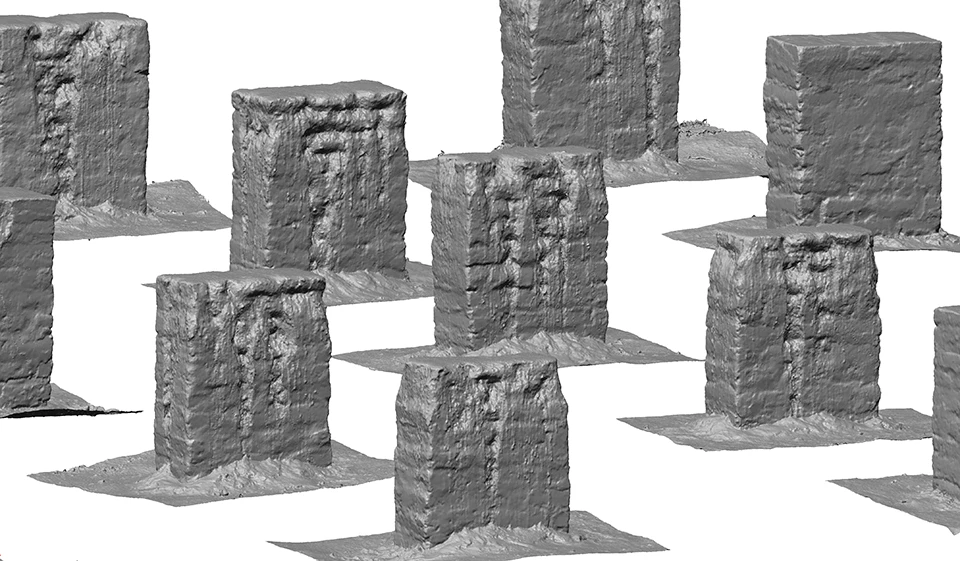
Right image
LiDAR imagery of adobe walls after rain simulation
The scans revealed that as rain intensity increased, so did material loss (see table). Walls subjected to the 1-year intensity treatment lost a mean of 0.51% of their total volume, while the 100-year treatment caused a 5.6% loss. Statistical analysis (one-sided t-tests with p <0.0003 for each treatment) indicated the results were strongly significant.
| Return interval | Material loss | Surface area affected (sq cm) | Mean max cavity depth (cm) |
|---|---|---|---|
| 1-year event | 0.51% | 912 | 5.5 |
| 25-year event | 3.30% | 4,672 | 8.2 |
| 100-year event | 5.60% | 6,400 | 9.2 |
The more-intense storms also affected a larger surface area. Affected surface area ranged from 912 square centimeters for the 1-year treatment to 6,400 square centimeters for the 100-year treatment. Mean maximum cavity depth also increased with intensity.
Data from the moisture sensors was less informative—likely because a majority of the rain ran off the walls, rather than soaking into them. Because both sensors tracked closely with the diurnal effect of temperature and the relative humidity of the surrounding air, it was difficult to tease apart the causes of observed moisture increases.

What We Learned
More intense rain events meant more erosion. The relationship between precipitation intensity and material loss was exponential (see graphic). This tells us that increasing rates of precipitation intensity resulted in increased erosion. We saw a large difference in both precipitation intensity and material loss between the 1-year and 25-year treatments. Doing additional treatments at intensities between those levels would help us better understand the rate of material loss.
The terrestrial laser scanning was an effective method of monitoring loss and quantifying the results. It was, however, extremely time-intensive. There is a point at which the amount of erosion that occurs in 30 minutes is significant enough to warrant both concern on the part of managers and the resources and time it takes to do the scanning. Identifying that intersection would make monitoring adobe structures at parks more efficient.
In each 30-minute rain treatment, the amount of material loss from the bare adobe walls was high, especially when considering the compounding effect of multiple monsoon storms. This highlights the vulnerability of bare adobe and importance of appropriately protecting the walls.
Sensor data were difficult to interpret. Some moisture sensors responded more strongly to the rain treatment than others. This may be related to the specific area where the walls eroded, or to water moving through cracks. The soil-moisture sensors were more sensitive to the rain treatments than the soil water potential sensors. This may be because all the soil-moisture sensors were placed higher in the wall, allowing moisture to reach them first. The temperature-dependent readings of both sensors made it tricky to quantify the actual increase in moisture within the walls.
During a 30-minute rain event, there was only a short window of time when water could infiltrate the walls from the surface: the 30 minutes during the event, plus a short period when pooled water could infiltrate the top of the wall. Longer rain events, or multiple rain events, may allow more water to penetrate the wall more deeply, increasing the volumetric water content.

Management Applications
Each stage of this project instilled knowledge and skills in its participants that will enhance preservation of cultural resources in the US Southwest. At a fundamental level, it’s important to know how the resources we’re protecting were made in order to make effective decisions about their conservation. But the larger lesson was the interdisciplinary cooperation required for success. Gathering together experts from hydrology, climatology, archeology, geography, and historic preservation was logistically complicated but necessary. It was also fascinating, interesting, and rewarding—and sparked new ideas for collaborative research.
The overall goal of the project—to measure the effect of different rain intensities and durations—was achieved: the results provided quantitative thresholds of rainfall at which we can expect major loss of unprotected abode materials. With surprising consistency, we detected a clear threshold in material loss between 1- and 25-year events. As we continue to monitor rainfall, as predictions of rain events improve, and as we conduct the next round of experiments, this key knowledge will help managers to design effective mitigation treatments and predict when they can be most effective.
We also learned some other things along the way.

Perhaps ironically, one of the most difficult parts of this project was protecting the walls and bricks from ambient rainfall. Bricks stored in low spots were especially vulnerable to melting in natural rainfall before they were ever subjected to simulated rainfall. Rain tarps turned out to be one of the project’s most important pieces of equipment. Making bricks and building walls in winter, and conducting treatments in the spring, would likely reduce the amount of vigilance required to protect the bricks from natural weathering.

In order to make accurate comparisons between rainfall events, it was essential that each LIDAR session be co-referenced as accurately as possible. To accomplish this, we placed five vertical segments of galvanized pipe throughout the site. During each session, a white plastic sphere, 150 millimeters in diameter, was placed atop each pipe segment as a reference point. These spheres, specifically built for this purpose, are treated with a shatterproof coating that increases albedo. The high albedo increases the reflections off the spheres during the LiDAR scanning, which in turn increases the accuracy of the scan. The nature of spheres ensures that the centerpoint of each sphere is located in exactly the same place each time the walls are scanned. This technique resulted in a detectable error threshold of about 4 millimeters.
The results also helped us determine the most appropriate and efficient use of LiDAR in the field. LiDAR is expensive and labor-intensive. The data collected in one week of field work require three weeks of processing, so identifying the threshold at which substantial material loss begins to occur is important. The closer we can narrow in on the threshold for material loss, the more efficient we can be with LiDAR use.
And happily, the project’s physical result has become a tool for public outreach. Our mini-Stonehenge attracts a lot of attention and questions, generating opportunities for interpretation of the connections between archeology and climate change.
Future Work
Future testing on our existing walls will help refine the initial results. Specific objectives are to:
- Investigate the cumulative effects of multiple storms,
- Experimentally test plaster amendments and other mitigation techniques to determine which are most effective at protecting the underlying historic and prehistoric materials, and
- Determine the rainfall conditions at which the intersection of management concern and cost-efficiency of LiDAR scanning occurs.
Because of the diversity of building techniques used across the Southwest, we also need to test other materials. Even within Sonoran Desert Network parks, the specific knowledge gained from this project has limited applicability—primarily to Tumacácori NHP and Fort Bowie National Historic Site. To simulate the adobe at Casa Grande Ruins National Monument, for instance, the walls would have to be built differently, as the prehistoric structures at that park were built with puddled adobe (i.e., no mortar).
Taking the current work a step further, it would be exciting to test the effects of water infiltration on subsurface artifacts. Knowing which sites might be most likely to be degraded could help managers prioritize exploration and excavation projects.
Sources and Support
Filippone, C. 2018. “Moisture Monitoring Observation Through May 1, 2018,” in 2017 Preservation Report, Pecos National Historical Park.
Lim, A. B. 2019. Treatment report: Emergency repair of Tumacacori church wall failures, Mission San Jose de Tumacácori, Tumacácori National Historical Park, Santa Cruz County, Arizona. Unpublished report.
Raymond, K. 2019. Draft summary of water moisture sensor data: First simulation of the adobe test walls. Unpublished report.
Rockman, M., M. Morgan, S. Ziaja, G. Hambrecht, and A. Meadow. 2016. Cultural Resources Climate Change Strategy. National Park Service Cultural Resources, Partnerships, and Science Directorate and Climate Change Response Program, Washington, DC.
This project was made possible by funding from the National Park Service's Albright-Wirth Grant program and National Center for Preservation Technology and Training, in cooperation with the US Department of Agriculture's Forest Service and Agricultural Research Service, the US Bureau of Land Management, and Archaeology Southwest.
Tags
- tumacácori national historical park
- adobe
- archeology
- historic preservation
- climate change
- lidar
- science
- sodn
- sonoran desert network
- desert research learning center
- climate science
- cultural resource protection
- cultural resource management
- tumacacori national historical park
- climate change adaptation
- research
- archaeology
- cultural resource
- cultural resources
- climate change impacts
- climate change effects