NPS photo from 2008
Importance
From year to year, any number of events can alter landscapes in and around North Coast and Cascades Network parks, including landslides, fires, clearcuts, and human development. These landscape changes occur at a wide variety of scales of time, extent, and magnitude, from a small flood that scours a riparian zone to a large fire that burns thousands of acres. Regardless of size and severity, each event can have lasting effects on the rest of the ecosystem, which include changes in hydrologic regimes, nutrient cycling, water quality, distribution of exotics, and quality of wildlife habitat. The Landscape Change monitoring program detects and maps where these landscape changes occur, how severe they are, and how long they last. The goal of this program is to document current rates of landscape change providing a baseline against which human-induced change can be compared in the future.
Management Applications
- Provide knowledge about trends in the size, frequency, or severity of landscape change events for land management and facilities planning.
- Provide a landscape-scale context for interpreting trends documented in other North Coast and Cascades Network monitoring projects.
By documenting landscape change over long periods, North Coast and Cascades Network National Parks can better assess the risks of climate change to natural and cultural resources.

Take a visual tour through 30 years of landscape change in the North Coast and Cascades Network
We use satellite remote sensing to track patterns of fire, flooding, landslides, and other natural disturbances over time. Through this analysis, we are gaining insight into how climate change may already be altering disturbance patterns across the wilderness of the Pacific Northwest. See what we're learning thus far in 30 years of monitoring landscape change in NCCN parks through our new story map! Clicking on the image to the left will also open the story map in full screen mode.
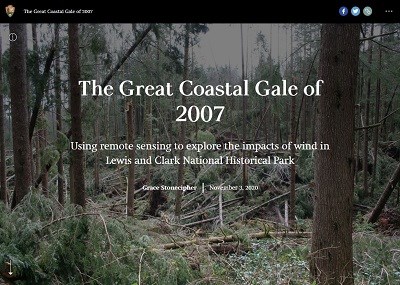
The Great Coastal Gale of 2007, Lewis and Clark National Historical Park
Tracking natural landscape change over long periods of time can help us in predicting the effects of climate change on park natural and cultural resources. This story map explores how the natural disturbances caused by several very large storms in the winter or 2007 impacted such resources at Lewis and Clark National Historical Park and how mapping the extent of these changes assists park managers in decision-making. Explore the story map in full screen mode (or click on the image to the left).
Monitoring Objectives
The Landscape Change monitoring program uses satellite imagery, Geographic Information System, and statistical analysis to evaluate landscape changes in and around network parks. The program tracks the size, duration, and intensity of each landscape change. The specific objectives are to:
- Detect and map landscape changes that are larger than 0.8 ha (2 ac) resulting from an avalanche, clearing, development, fire, mass movement, progressive defoliation, riparian flooding, or tree toppling.
- Determine trends in the size, magnitude, location, and spatial distribution of each landscape change category.
Basic Approach
Each year, Landsat images undergo analysis using a program called Landsat-based Detection of Trends in Disturbance and Recovery (LandTrendr) to detect new areas that have changed compared to the previous year. Individual patches larger than 0.8 ha (2 acres) and where at least 10 percent of the vegetation has been removed are delineated. Next, the patches are labeled with a change agent, such as fire, mass movement, clearcut, or riparian flooding. To create the label, a statistical model combines information about the patch’s shape, size, and location on the landscape with the information about the event duration and magnitude from the Landsat images. For example, a square-shaped patch outside the park boundary in which a tall forest canopy has been removed and only bare ground remains is likely to be a clearcut. Maps of the change areas are created for each park every three years.
Reports and Publications
Source: Data Store Saved Search 553. To search for additional information, visit the Data Store.
Source: Data Store Saved Search 3707. To search for additional information, visit the Data Store.
Last updated: January 15, 2025
