With the ever increasing amount of inventory and monitoring data available for use, the Inventory & Monitoring Program has recognized the importance of developing tools that increase awareness of and facilitate utilization of these data for the benefit of informed resource management.
As example numerous collaborative data visualization and data dissemination efforts are under way at the Rocky Mountain Network. These efforts are being performed in a collaborative environment with other Inventory & Monitoring networks, the national level Inventory & Monitoring Program, the NPS Natural Resource Stewardship and Science directorate, and other collaborating partners.
See below for further information:

Air Quality
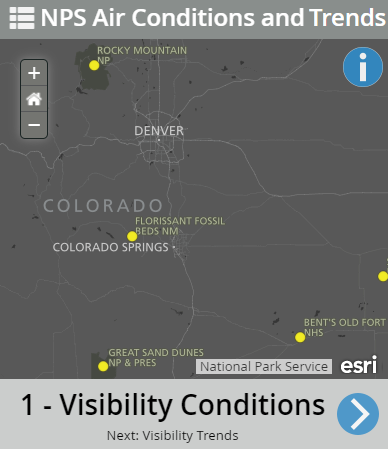
Air quality affects parks across the country. The National Summary map provides a nationwide look at park conditions and trends for visibility, ozone, nitrogen deposition, and sulfur deposition. This information is based on monitoring data and National Park Service analysis methods. Learn more about park-specific air quality by exploring the Park Conditions & Trends page.

Climate
The Climate Analyzer data portal can be used to foster use of climatic data across Rocky Mountain Network parks for monitoring activities and subsequent analyses. Data sources harvested and available for display and analyses include climatic data from the National Weather Service (COOP/GHCN data), NRCS Snow-Telemetry (SNOTEL), Remote Automated Weather Stations (RAWS), and Hydrological data from USGS stream and lake gages. Climate analyzer has been developed by Walking Shadow Ecology, and is currently used by numerous Inventory & Monitoring networks and parks. For additional information visit the climate analyzer website www.climateanalyzer.us.

Landscape Dynamics
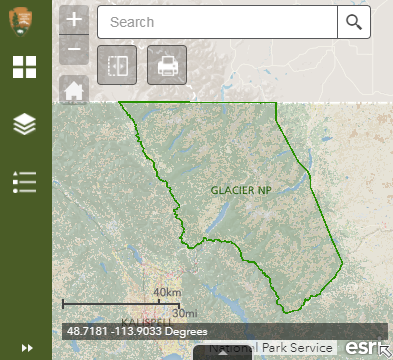
The Landscape Dynamics metric viewer provides a user-friendly, interactive map that allows non-GIS specialists to explore Landscape Dynamics GIS data. From the viewer, users can click on and off different layers, alter layer order and transparency, pan and zoom to areas of interest, and save custom professional cartographic maps for use in reports or briefings. Consult the FAQ page (upper right corner of viewer) for guidance and tips.

Snow Chemistry
The USGS Colorado Water Science Center conducts hydrologic projects that address a wide variety of water-resources issues, including water supply, ground-water contamination, nutrient loading in streams, effects of land use on water quality, and basic hydrologic data collection. The Rocky Mountain Regional Snowpack Chemistry page provides an overview of the history of this project and their objectives, an interactive map of their sampling sites in the Rocky Mountain region, downloadable data, photos, and publications related to this project.

Water Quality - Continuous Loggers
Rocky Mountain Network Integrated Water Quality data is available for graphical display and data download on the Natural Resource Stewardship and Science AQUARIUS WebPortal. The network's continuous water quality data on AQUARIUS includes atmospheric pressure, dissolved oxygen, pH, specific conductance, water temperature, and turbidity.

Water Quality - Discrete Water Samples
The National Water Quality Data Portal stores the Rocky Mountain Network’s discrete water quality data from collected and tested water samples. The National Water Quality Data Portal is a cooperative service sponsored by the United States Geological Survey (USGS), the Environmental Protection Agency (EPA) and the National Water Quality Monitoring Council (NWQMC) that integrates publicly available water quality data from the USGS National Water Information System (NWIS), the EPA, and the USDA ARS Sustaining The Earth’s Watersheds - Agricultural Research Database System (STEWARDS). To download Rocky Mountain Network-specific water quality data from the National Water Quality Data Portal, click the download link.
Last updated: November 6, 2020
