NPS photo / SECN staff

NPS photo / SECN staff
Overview
Located in north-central Georgia, Chattahoochee River National Recreation Area is comprised of multiple park units totaling 2,139 hectares (5,285 acres), which are sited along a 77-kilometer (48 miles) stretch of the Chattahoochee River corridor (Figure 1). The park extends south and west from Buford Dam at Lake Sidney Lanier to the city of Atlanta in the south. Buford Dam controls flow to the Chattahoochee River and thereby modifies river's hydrology and temperature. Due to its association with Atlanta and surrounding cities, Chattahoochee has one of the most prominent wild and urban interfaces of SECN parks and experiences high visitation and recreational use. Management challenges include encroachment by development, invasive and non-native plants and animals, polluted runoff, and human use pressures. However, there also remain many areas of the park which provide solitude and respite from the nearby urban environment and the park hosts a diverse mix of flora and fauna.
The Southeast Coast Network conducts the following monitoring at Chattahoochee River National Recreation Area:
- Wadeable stream monitoring began in 2017 at Chattahoochee River National Recreation Area and the network monitors 13 streams sites in the park. Surveys have been conducted at these 13 sites in 2017, 2021, and 2024. The monitored streams are small tributaries (first- to third-Strahler order) that feed the mainstem along the Chattahoochee River NRA-authorized area. These streams are heavily impacted by the direct and indirect effects of urbanization as well as legacy effects of past land use, primarily deforestation in support of row crop agriculture resulting in widespread soil erosion. Each stream is recovering from its unique history of land use and seeking to equilibrate to its current flow and sediment regime. Methods used to monitor stream habitats at the park were primarily based on existing published methods from USGS, USFWS and EPA. Data are collected to assess both status and trends in upstream and watershed influences on stream habitat, changes to channel geomorphology, and benthic and instream habitat features.
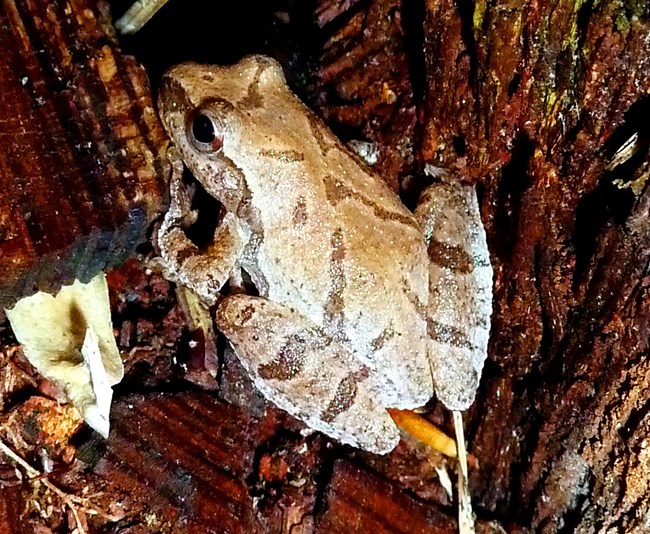
- Landbird community monitoring and Vocal anuran community monitoring is conducted on a rotating schedule every three years. These wildlife communities play critical roles in park ecosystems and interact with several trophic levels of food webs. The network uses automated recording devices (ARDs) to collect vocalization data during mornings and evenings in the spring, which are analyzed by bioacoustics specialists. Data collected from these vital sign monitoring efforts help assess the ecological integrity and diversity of park areas and how communities and park conditions may change over time. The landbird and vocal anuran monitoring efforts in network parks began in 2012.
- Vegetation community monitoring began in 2021 and is conducted on a rotating schedule every three years. Monitoring vegetation is important because it’s key indicator of overall ecosystem health. Changes in vegetation reflect the effects of stressors like extreme weather, disease, invasive species, fire, and land use change. Plant communities also provide structured habitat and food resources for other species. At Chattahoochee River National Recreation Area, vegetation plots have been established across the following habitats: Piedmont Alluvial Wetlands and Piedmont Upland Forests. Vegetation monitoring data provides managers with information about the degree of change in their park’s natural communities. Data reports include information about new occurrences and rare plants, species richness and abundance, tree health and regeneration, disturbance observations, soil nutrients, landform/geomorphology, and downed woody debris.
| Vital Signs | Examples of Measurement |
|---|---|
| Wadeable Stream Habitat | Stream channel morphology (heights, widths, depths), channel gradient, bed sediment particle size, large wood inventory, distribution of geomorphic channel units, canopy cover |
| Landbird and Vocal Anuran | Species occurrence, distribution |
| Terrestrial Vegetation | Plant community diversity, relative species/guild abundance, structure/age class, incidence of disease |
Source: Data Store Collection 3952 (results presented are a subset). To search for additional information, visit the Data Store.
Source: Data Store Collection 3951 (results presented are a subset). To search for additional information, visit the Data Store.
Source: Data Store Collection 3955 (results presented are a subset). To search for additional information, visit the Data Store.
Source: Data Store Collection 9579. To search for additional information, visit the Data Store.
Source: Data Store Collection 3954 (results presented are a subset). To search for additional information, visit the Data Store.
Source: Data Store Collection 9571. To search for additional information, visit the Data Store.
Source: Data Store Collection 3953 (results presented are a subset). To search for additional information, visit the Data Store.
Last updated: November 11, 2024
