![]()

Cover Page
MENU
SECTION I
SECTION II
History
Needs
Geography
Historic Sites
Competitors
Economic Aspects
SECTION III
Federal Lands
![]() State and Interstate
State and Interstate
Local
SECTION IV
Division of Responsibility
Local
State
Federal
Circulation
SECTION V
Recreational Use of Land in the United States
SECTION III
PRESENT EXTENT AND USE OF PUBLIC LANDS FOR RECREATION
2. STATE AND INTERSTATE SYSTEMS
Partial Recreation Survey of Representative State
Parks
During a few weeks in the late summer of 1934, questionnaires were distributed in 46 representative State parks from among the 907 such parks in the country. Over 25,000 questionnaires were filled out, and from these the following information has been compiled.
On the trips then being taken the travelers reporting were going an average distance of 541 miles at an average cost of $42.90 for the trip (practically 8¢ per mile). In some of the parks, which offer primarily neighborhood recreation or a chance to be out of doors, the average distance of travel is as low as 36 miles (Palisades Park, New Jersey). In those parks which are along trunk highways, where they serve as stopping points for through tourists, the average distance of the trips reported runs as high as 788 miles in Massachusetts, (Mount Greylock State Park) and 2,192 miles in South Dakota (Custer State Park).
Where a State park contains a feature of widely famed interest—the type of attraction more characteristic of the national park—the reports show average distances of travel such as 1,717 miles (Humboldt Redwood State Park, California). Famous recreation grounds bring visitors from equal distances: Mackinac Island State Park, Michigan, was reached on trips averaging 1,193 miles in length; Itasca State Park, in Minnesota, on trips averaging 1,242 miles.
These widely known recreation grounds also have more visitors from a higher-salaried group than have the parks of more localized reputation.
The total length of the trips reported on the 25,832 questionnaires was 13,088,829 miles. The total cost of these trips, as estimated by the travelers, was over a million dollars ($1,037,154).
To get a more complete idea of the recreational or semi-recreational travel which these figures indicate, it must be realized that they are from about one twentieth of the State parks, that they were compiled over a short period and that each questionnaire represents one party rather than one person, the average size of party being 3.34.
The visitors were asked about the number, length, and cost of their trips during the entire year, and estimated that they would make:
12,500 yearly vacation trips averaging 706 miles.
69,000 week-end trips averaging 131 miles.
150,000 day outings averaging 64 miles.
This would make the yearly recreational travel of these parties total 27,516,979 miles. The recreational interests and occupations shown on these 25,832 questionnaires are depicted in figures 28 and 29.
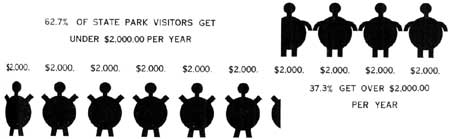
FIGURE 26.
FIGURE 27.
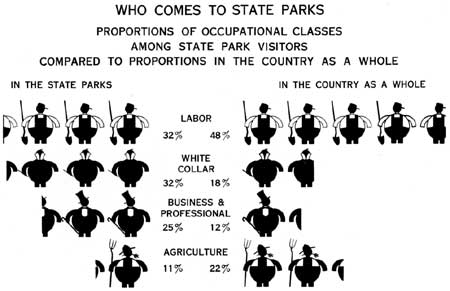
FIGURE 28.
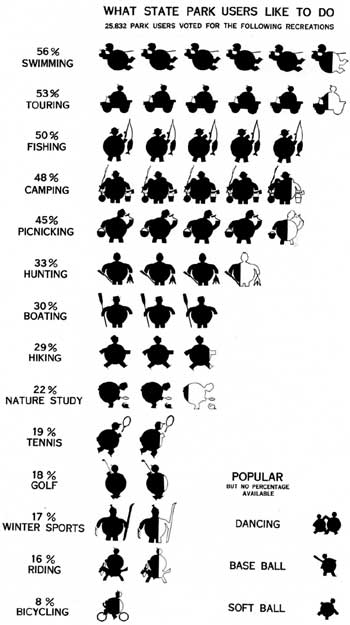
FIGURE 29.
 Top
Top
Last Modified: Fri, Sep. 5, 2003 10:32:22 am PDT
http://www.cr.nps.gov/history/online_books/recreational_use/chap3-2d.htm
![]()