|
HAWAI`I VOLCANOES
Invasion and Recovery of Vegetation after a Volcanic Eruption in Hawaii NPS Scientific Monograph No. 5 |

|
CHAPTER 7:
Environmental Conditions
The Climatic Gradient
The climatic gradient over the study area from Kilauea Iki (habitat 1) to the upper Kau Desert (habitat 6) along transect AA' (Figs. 2 and 3) was already briefly described on page 11. Initially, the existence of this gradient was only assumed from the long-term climatic records of nearby stations at Hawaii Volcanoes National Park headquarters and Halemaumau. respectively. It thus seemed important to test the reality of this gradient and to find out how much of the evolving plant invasion and recovery patterns can be explained by the climatic gradient.
Temperature and relative humidity
A comparison between habitat I (Kilauea Iki lava floor) and habitat 6 (upper Kau Desert, at end of transect AA', Fig. 2) is shown in Fig. 19. The records are from hygrothermograph charts for 2 years of observation (1967 and 1968). Abstracted from these charts were the mean number of hours per day for each month of the year during which the air temperature exceeded 20°C Similarly, the mean number of hours per month were counted during which the air temperature was below 15°C The two curves are shown for each habitat on the left side of Fig. 19. Each curve represents the mean trend for the 2 years. The time of a moderately warm growth climate, defined as between 15°C and 20°C air temperature, was of longer duration (by about 1.5 months) in habitat 1 than in habitat 6. The comparison also shows that there were twice as many cool hours under 15°C from November through May in the Kau Desert habitat than on the Kilauea Iki crater floor. Thus, in terms of air temperature, habitat 1 was more moderate than habitat 6. The relative humidity record was similarly abstracted from the charts for the mean hours per day in each month that showed relative humidities over 95% and under 65%, respectively. The right side of Fig. 19 shows that the number of atmospherically humid hours (over 95% relative humidity) was greater for almost every month of the year for habitat 1 than for habitat 6. Also, there were more total hours through the year with relative humidities under 65% in habitat 6. Thus, as expected, the data show that the Kau Desert habitat (6) was consistently drier than the rain-forest habitat (1) of Kilauea Iki.

|
| Fig. 19. Comparison of temperatures and relative humidity for habitats 1 and 6. |
Desiccating power, insolation, and rainfall
Figure 20 shows the relative drying power of the atmosphere for habitats 1, 4, 5, and 6 in relation to the monthly rainfall for a period of 9 months, from May 1968 through January 1969. The relative desiccating power is expressed in terms of mean daily water loss per week from Livingston white and black bulb atmometers. General comparison of the four diagrams shows that the desiccating power in habitats 1 and 4 was quite similar; in habitat 5 it was lowest, and in habitat 6 it was greatest. The same is shown by the 9-month daily mean values (M) stated for the white bulb readings on each diagram. The low readings in habitat 5 relate to the wind protection afforded by the recovered trees. The atmometers were all at 30 cm height above the ground in open places, where they measured the atmospheric environment of low-growing plants. the frequently greater range between white and black bulb values in habitat 6 as compared to 4 (or the other habitats) indicates also the greatest average insolation and thus light intensity for habitat 6. Therefore, the climatic gradient shows only a small difference in terms of desiccating power along the first kilometer from habitat Ito 4. Both habitats are in the terrain of the original rain forest (Fig. 2). However, there was a distinct decrease in rainfall as can be seen by comparing the equivalent monthly rainfall amounts of habitat 1 with those of habitat 4.

|
| Fig. 20. Mean daily loss of water (cc) per week from white and black Livingston atmometers, and monthly rainfall (mm) in habitats 1, 4, 5, and 6. |
Figure 21 indicates the relationship between mean daily water loss per week (cc) and rainfall per week (mm) for the four habitats. The curves show that if, for example, the weekly rainfall is 125 mm, the daily white bulb evaporation in habitat 6 can be expected to be 16 cc; in habitat 1, it can be expected to be about 7 cc; and in habitats 4 and 5, 3.5 cc. This reemphasizes that the atmospheric drying power of habitat 6 was greatest, but it also shows that the evaporating power in habitat 1 was somewhat greater than in habitat 4. This was not related to a greater direct insolation or greater wind intensity, but probably was an effect of the greater substrate heat radiation on the crater floor (see under substrate temperature, p. 69).

|
| Fig. 21. Relationships between evaporation rate of white bulb atmometers (mean daily water loss in cc/week) and monthly rainfall (mm) in habitats 1, 4, 5, and 6. Data from May 1968 through January 1969. |
Mean rainfall and dry periods
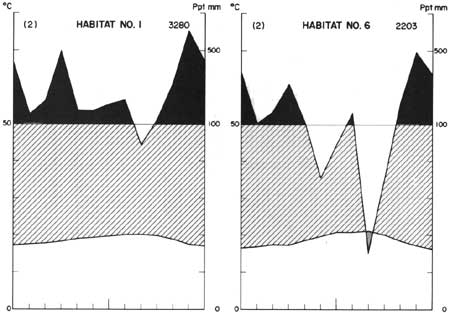
Figure 22 shows a climate diagram for both habitat 1 and habitat 6, prepared after the method of Walter (1957). These diagrams present the mean monthly rainfall and mean monthly temperature for 1967 and 1968. The rainfall curve is plotted with reference to the right-hand ordinate on each diagram and the temperature curve with reference to the left-hand ordinate. The 12 months of the year, from January to January, are indicated by the dashes on the abscissa, with July indicated by the central dash. The temperature curves show little difference on this basis, but the rainfall curves do. If a dry period is defined as a monthly rainfall of less than 100 mm, then habitat 6 showed two dry periods, one in June and one in September. The September dryness was particularly intense. However, the annual mean rainfall stated as 2203 mm for habitat 6 is as high as recorded for some tropical rain forest areas (Walter and Lieth 1960). Therefore, the upper Kau Desert is certainly not a climatic desert. The mean annual rainfall values in Fig. 22 indicate a rainfall gradient of more than 1000 mm over the study area.
|
| Fig. 22. Climate diagrams for habitats 1 and 6. Mean monthly air temperatures (°C) and precipiation (ppt mm) for 2 years (1967 and 1968). Mean annual rainfall stated under ppt mm. |
Substrate Diferences
The gross substrate differences have already been emphasized under the section describing the new volcanic habitats (pages 13-19). They are summarized briefly on the habitat map (Fig. 2) and the profile diagrams (Figs. 3 and 4) in that section.
Additionally, a few analyses of substrate temperature, moisture, and chemical and mineralogical properties were made.
Substrate temperature
Substrate temperatures of habitats 1 and 2 have changed considerably over the study period. After the eruption stopped, the thin crust of the crater floor in habitat 1 was very hot. The floor steamed heavily during and after a rainfall. Nine years later, most of the steaming was concentrated toward the center of the lake, but a few areas of steaming cracks radiated toward the edge of the crater. In March 1960, two holes were drilled into the crust over the deepest portion of the lake (115 m) to gain information on the rate of cooling (Ault et al. 1961). At this time the lake crust was about 4 m thick and the melt beneath was over 1000°C This melt temperature compared with that of 1060-1190°C measured in the lava fountain during the eruption. Continued drillings and temperature measurements have been made over several years, and, by 1968, the crust was about 30 m thick and the melt beneath was 1065-1090°C (Fig. 3).
Generally, there has been a continued crustal temperature increase toward the center of the lake. Surface temperature measurements made in September 1968 at the warmest period of the day, and across the lake toward the center (from east to west), gave the following results: at 3 m from edge, 43°C at 30 m, 52°C; at 300 m, 54°C; at 500 m, 60°C. Earlier, still higher surface temperatures (70-74°C) were recorded during the same summer season at 300 m and 500 m points. These higher temperatures prevailed at midday during a dry spell when the black, glassy surface of the massive pahoehoe lava had been exposed to intense sunshine in the morning. This temperature gradient corresponded to the invasional pattern of plants observed. In year 9 (1968), algae and lichens had penetrated to 250 m (54°C) on the crater floor, while ferns and mosses followed closely. Native woody plants were established up to 114 m (52-53°C), but the exotic grasses and forbs had penetrated less than 20 m (43°C)
Temperature measurements were also made in joint cracks where Nephrolepis exaltata was established. During the warmest part of the day, the temperature at the places of rhizome attachment were up to 13°C below the surface temperatures. The exposed joint faces, which consisted of dark red and greenish black strata, varied in surface temperature. When equally exposed to the sun, the black, glassy, and red surfaces became much warmer (39.0°C) than the greenish-black surfaces (35.5°C)
The cinder-cone summit of habitat 3 took a long time to cool off. During the first 3 to 4 years after the eruption, the summit steamed vigorously after each rainfall. Steam rising through the hot mound of cinders and buried forest caused considerable hydrothermal alteration in the pyroclastic material. In the first 2 years, large deposits of whitish to orange sublimates were deposited around the steaming fissures on the summit. The summit and slope temperatures remained high for several years. In July 1963, Fox (1964) made several temperature measurements along the east slope. He reported a surface temperature of 20°C at the lower slope of the cone. Further up, the temperature began to increase steeply, and at about one-fourth of the distance from the summit, temperatures of 150-160°C were recorded within 10 cm of the surface in year 4. In this area of the summit, native woody plants (Vaccinium reticulatum, Dubautia scabra, and Metrosideros polymorpha) were noted only in year 9 (1968). At that time only a few fissures continued to emit steam.
Thus, in habitats I and 2 substrate surface temperatures—controlled primarily by the slow cooling pattern of the interior of the new volcanic habitats—were correlated with the observed plant invasion pattern. In habitat 1 this explains in part the concentric progression of plant life toward the center. In habitat 2 the still slower cooling of the surface partly explains the delay till year 3 (1962) of the first algal appearance (Appendix Il).
Substrate moisture
The properties tested were simulated field capacity and permanent wilting percentage of the pyroclastic materials. Unexpectedly, there were no significant differences in the soil moisture constants between spatter and pumice materials. Their simulated field capacities (FC) varied from 33% to 46% (by weight), their permanent wilting percentages (PWP at 15 atm) varied from 31% to 43%. Thus, available water (defined as the difference between FC and PWP) ranged only from 2% to 3%. Small cinder blocks from the summit of the cinder cone (habitat 2) had a field capacity of only 15%, but available water was even slightly greater with 3.7%. However, this difference was probably not significant. Thus, there is less water available in these new volcanic materials than in most soils including sands, and plants will have water for growth only for short periods after showers.
This is further corroborated by the substrate moisture values shown in Table 7. Even 48 hours after a prolonged shower in excess of 100 mm, the moisture downward in several ash profiles was barely in the range available to plants. The values in Table 7 may show two things: first, that a 2-day evaporation had dried up the upper 5 cm considerably below the wilting percentages; second, that even a prolonged shower may not wet the ash particles to capacity. A plant rooted in the upper 25 cm therefore would grow actively only for a short period following profile wetting. This may also explain the greater success of more deeply rooted woody plants and of herbaceous plants with thick rhizomes (ferns) or bulbs.
TABLE 7. Substrate moisture (% weight) in volcanic ash profiles 48 hours following a rain shower in excess of 100 mm. Each value represents the mean of 10 samples.
| Depth of sample | Habitat | ||||
| 2 | 3 | 4 | 5 | 6 | |
| 1-3 cm | 8.5 | 12.4 | 16.2 | 22.6 | 3.5 |
| 3-5 cm | 10.0 | 14.4 | 18.0 | — | 11.0 |
| 8-12 cm | 14.0 | 20.5 | 20.5 | 33.0a | — |
| 15-25 cm | 20.0 | — | 45.6 | 40.0 | — |
aOnly the blocked-out values are in available range. | |||||
Plant nutrients in soil and rain water
The volcanic substrates of all six habitats originated more or less simultaneously from the same source. The rock source is described as olivine basalt (Macdonald and Hubbard 1966). The basic chemical constituents in these physically different materials is known to differ little. However, the question of concern here was whether this is true also for the exchangeable and available plant nutrients.
Nutrient analyses were made from chipped off lava rock material of habitat 1 and for ash material of habitat 2. The values are shown in Table 8. Both the lava rock (habitat 1) and the volcanic ash (habitat 2) have some nutrient capability as indicated by the chemical analysis.
TABLE 8. Exchangeable cations and available phosphorus and nitrate in two volcanic substrates 8 years after deposition. All values in ppm.
| Nutrients | Lava depth 0-2 cm |
Volcanic ash | |
| 0-2 cm | 8-12 cm | ||
| Exchangeable | |||
| Ca | 4.4 | 7.4 | 3.0 |
| Mg | 1.0 | 3.6 | 1.5 |
| K | 1.4 | 5.6 | 2.8 |
| Na | 2.0 | 5.0 | 1.0 |
| Available | |||
| P | 5.3 | 0.8 | 1.2 |
| NO3 | 6.7 | 59.9 | 14.7 |
The surface values of exchangeable cations for the ash are higher than for the lava. However, these were single determinations only. It appears conceivable that the greater surface area associated with the finer particle size of the ash is consistently correlated with higher values for exchangeable cations. The higher NO3 values of the ash samples in comparison to the lava are rather striking. In Hawaiian agricultural soils, NO3 values of between 5 ppm to 40 ppm are considered normal (Dr. Y. Kanehiro, pers. comm.). Thus, the value for the surface 3 cm of the volcanic ash on the cinder-cone habitat is extremely high and may have been a local unconformity. Nevertheless, the subsurface ash value is more than twice as high as that on the lava. Moreover, it is interesting that even the NO3 value on the lava rock falls into the range of what is considered a "normal" NO3 amount for mature soils.
A number of pH determinations were made for the surface and subsurface material in August 1967. These are shown in Table 9.
TABLE 9. Substrate pH values at surface and subsurface in six new volcanic habitats. Values stated are the most frequent out of 10 determinations each.
| Habitat | Surface 0-2 cm |
Subsurface | |
| at 10 cm | at 20 cm | ||
| 1 | 6.4 | — | — |
| 2 | 5.0 | 6.2 | — |
| 3 | 4.5 | 5.0 | — |
| 4 | 5.0 | 6.3 | 6.3 |
| 5 | 5.4 | 6.3 | 6.6 |
| 6 | 4.9 | 5.8 | — |
The pH values show a range from 4.5 to 6.4 for the surface of the ash substrates. They were more acid than the lava rock surface. Downward in the ash profiles, the pH values increased consistently. The increase of pH values with profile depth is quite normal for soils that have a higher organic content at the surface. In the ash substrates the organic content was not tested because it appeared negligible. The lower pH values at the surface were somewhat surprising. They could have been related to the surface nitrogen present. If the N were originally present in NH4+ form, an acid condition could result from the following reaction:
NH4+ + 2O2 --> 2H+ + NO3- + H2O.
Two rainwater analyses were made to see if there could have been any nutrient contribution through this source. The results are stated in Table 10. Both analyses were made at a time when volcanic fumes were blown from other active volcanic vents (Halemaumau and Aloi-Alae) toward the park headquarters and the study areas. This may account for the high amount of SO4 in each sample. It appears likely that the SO4 may contribute even more strongly than the N to the acidification of new volcanic surfaces discussed above.
It is interesting also that small amounts of NO3 were present in the rainwater. This quantity may have been sufficient to provide a basis for establishment of plant life on raw volcanic substrates that were initially devoid of organic nitrogen. Of course, also the NO3 in the rainwater must have an organic origin.
TABLE 10. Plant nutrients in rainwater (ppm) near the study area (Park Headquarters).a
| Nutrients | Feb. 68 | Feb. 70 |
| NO3 | 0.01 | 0.07 |
| Ca | 0.9 | 3.2 |
| Mg | 0.5 | 0 |
| K | 0.5 | 0 |
| SO4 | 2.5 | 3.7 |
aBoth samples were taken during volcanic fuming. | ||
Mineralogical properties
Examination of the lava rock and pyroclastics by X-ray diffraction analysis revealed that there were some differences in their mineral composition. Although all of these substrates have the same chemical composition, the minerals varied from the noncrystalline material in fresh pumice to the crystalline magnetite, olivine, and plagioclase feldspar in the spatter and lava rock. The X-ray tracings of these substrates are presented in Fig. 23.

|
| Fig. 23. X-ray diffraction tracings for habitat substrates showing gross mineralogy. |
These tracings reveal that pumice, a pyroclastic material which has cooled sufficiently fast, is composed primarily of glass. Under these conditions, it is not possible to detect crystallinity by X-ray diffraction analysis. However, the spatter and lava rock, which have cooled much more slowly than the pumice, show the presence of the crystalline minerals mentioned above.
Although the materials have been subjected to 9 years of soil-forming processes, based on X-ray techniques there is no noticeable alteration in the primary minerals except in the hydrothermally altered lava rock in habitat 1. Here, the petrographic microscope revealed some slight alteration of the iron bearing minerals to hematite.
Finally, Fig. 23 shows that the altered pumice, which contained sublimates deposited around fumaroles, was quite different in mineral composition when compared to the spatter and the lava rock. It was not possible to identify these sublimates. The same difficulty was encountered previously by Murata (1966), who collected deep orange pseudomorphs from the pumice that had been exposed to acid gases coming through fissures on the cinder cone. He concluded that the deep orange color was brought about by highly porous pseudomorphs absorbing large quantities of ferric chloride. An analysis of the pseudomorphic material showed that it contained 79.2% SiO2, 17.0% H2O, and other minor constituents commonly found in basalts. The composition corresponded to that of a hydrous silica, and the X-ray diffraction pattern of the same material showed a single diffuse maximum band typical of amorphous silica. Murata (1966) concluded that the steaming hydrochloric and sulfuric acids had decomposed the superficial pumice into the siliceous pseudomorphs. Yellowish nodules of pumice fragments cemented by crystallization of various salts (mostly chlorides) were also examined by Murata through X-ray diffraction analysis. Most of this material was amorphous, although small amounts of halite and anatase were present. A solution prepared of this material gave a strong test for Cl-, Fe2+, Fe3+, Mg2+, Al3+, and Na+ Thus, based on the results of Murata, there is strong suggestion that the secondary materials found on the cinder cone consist primarily of opal, a hydrous noncrystalline silica (a whitish deposit), gypsum (also a whitish deposit), hematite (a dark red material), and limonite (a yellow to orange material). Figure 24 shows a photograph of the cinder cone, which indicates the discoloration by these secondary materials.

|
| Fig. 24. The summit of the cinder cone photographed in year 3 (1962) after formation. |
| <<< Previous | <<< Contents >>> | Next >>> |
chap7.htm
Last Updated: 1-Apr-2005