- Duration:
- 26 minutes, 8 seconds
The role of technology in the fields of preservation, interpretation, and management is rapidly changing. We are interested in ways that federal, state, and local agencies tasked with work in these fields can best use emergent technology as a tool. Our research focuses on the question; what can emergent technologies do to help us reach our preservation and interpretive goals? Another focus of this research is into the limits of today’s technologies, the evolution of technologies, and technological obsolescence.
Tim Castillo: Okay, that sounds good. Thank you, thank you very much for the opportunity to come here today. This is a very different audience than I'm used to presenting to. I'm trained as an architect and been the director of this digital media lab at the University of New Mexico for the last seven years, and so this project that we're going to talk about is really a kind of a project that's been very dear to my heart in that I grew up in New Mexico. And really one of the things that we were very interested at the onset of this project was really looking at how to document culture and people and place.
And we started very early on looking at places like Albuquerque and then ultimately in rural context like Dixon Embudo. My colleague when we first wrote the grant to get the funding to do this is actually the current Dean of the School of Architecture, Geraldine Forbes. And we were really interested in using new technologies and emergent things to really start to tell the story of the people in this region.
And so when we started to think about this, we really didn't know what we were getting ourselves into to tell you the truth. We had met some people that were living in Dixon, and they really wanted to talk about ways of documenting that culture. It was a culture that basically was moving away from a kind of agrarian kind of context. Dixon Embudo had been settled by the Spaniards in the early 1600s. And so you can kind of see the Camino Real here in this image, and it really started from that and really thinking about, well how are we going to talk about the people, the land, the water and that evolution?
So in terms of, again, the historical legacy of the Spanish coming into this environment and settling it was really primarily what we were interested in and really looking at the kind of visual kind of complexity. So here's an image of Santa Fe very early on, and we were really interested in how we would set up a database that actually was communal; that'll allow people to think about how this history sort of evolved, and really creating a platform that multiple people could use.
So in terms of looking at the acequias, if you guys know what acequias are, they're basically a form of diverting water to lands in the landscape that allow people to farm off the land. So here's an example of an acequia system in Northern New Mexico. Another example. And then really the kind of communal and democracy of living and working in these communities.
So this is what they call la limpia, so basically “the cleaning”. So every spring they will come in as a community and, you know, sort of take it out and clean it up so that the water can start to flow and be able to allow that community to live off the land. And so we were very interested, and there's a whole communal sort of system that's evolved over time. There's the mayordomo who is basically the person that oversees a partition of land and the parciantes which are actually the people that have plots of land. And so every day or I guess every part of the week, people have certain timeframes to irrigate the land. So we were really interested in that and really the kind of cultural overlay.
We started to move into Dixon and really started to document it from a kind of very architectural kind of paradigm. We're looking at the kind of historical context in terms of the built environment, the infrastructure, but also in terms of the plots of land because they're very important to that evolution. And then we started to think about, "Well, how are we going to document this and think about it from a different context?"
Previously, I had been – I was educated in New York City - and I had been aware of this project called the Manhattan Transformations by Brian McGrath. And it was kind of a very early on Flash-based visualization that looked at the history of New York over time. This was probably around, I want to say, 2000, maybe 2001. I think maybe it might say it down there. I was really interested in the kind of explosion of data that could be organized in the format that would really talk about the historical evolution in a very kind of simplistic way.
Originally, we got funding to look at Albuquerque, so we were looking at four communities in Albuquerque: Old Town, Atrisco, Martineztown, and Barelas, and really looking at a way of bringing that together to tell the story of the history of the people. And so we used things like GIS. We brought it into a Flash-based format. And I bring this up because it was the limitations of the technology of the time, and it allowed for a kind of dynamic environment to be present on the web, so people could have access to it, but it also created limitations. So one of the things that I found out very early on was that GIS wasn't for everyone. In particular, for the audience that we wanted to hit, it wasn’t really, we wanted to hit the researchers but we really wanted it to impact the community. And so when we put this out and populated it on the web, it got very minimal kind of usage because people really didn't understand how to interact with that application.
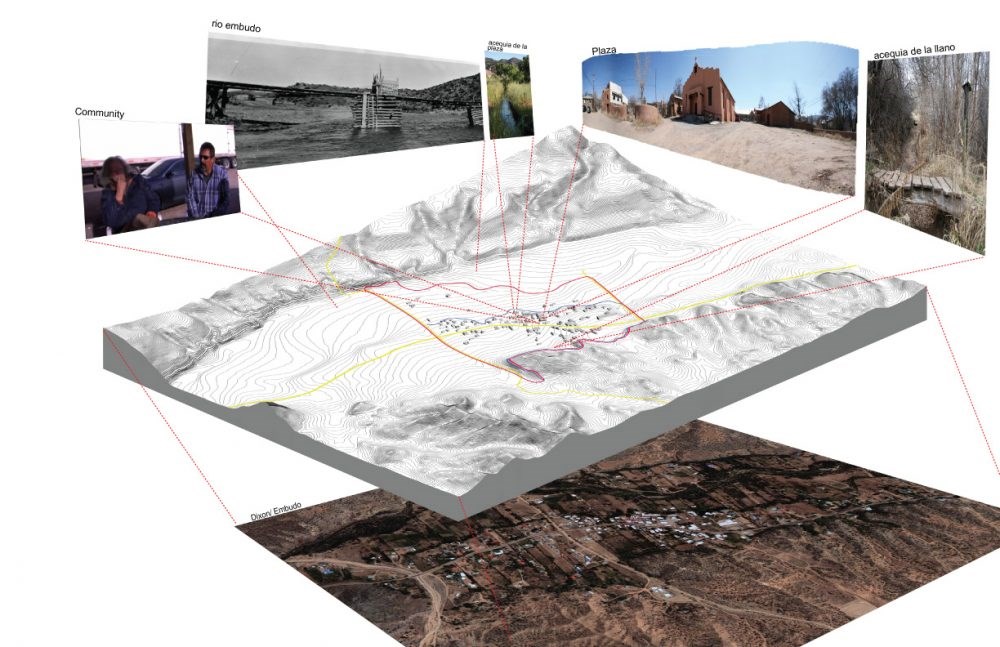
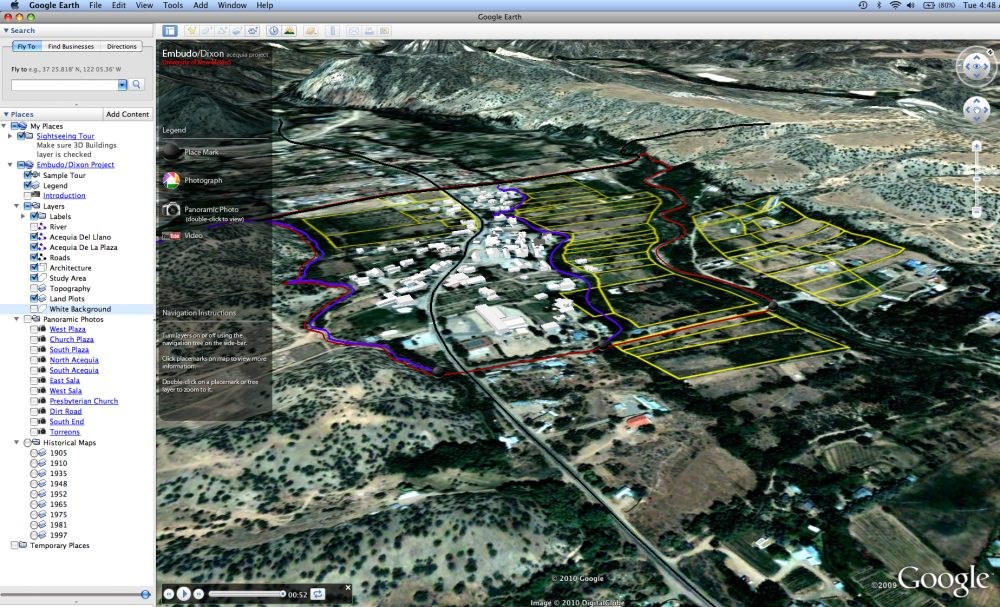
And so we went back to the drawing board and we started to think about coming up with a different kind of platform. So we went into the Google Earth kind of platform. It was at that time in about 2009, we started to look at what potential that had. And being a very open source application, we thought that it had great potential. And being able to bring the layers from GIS but also using things like SketchUp, using Street View, as ways of articulating that place, and really breaking down these layers.
You can kind of see here some of our early visualizations just talking about the context. We're using panoramic photography as a way of articulating that space and really looking at the history of the contemporary issues and also the historic issues that comprise that community. Again, water being a primary element in Dixon and then really working with the community. So this is Esteban Arellano. And so if you're from New Mexico and you're aware of the acequia tradition, Esteban Arellano was one of the foremost authorities on the history and evolution of acequias basically in our region. And so he was a great contact and he really allowed us the opportunity to get to the community, to talk to them, to really understand their history, you know.
One thing that we were trying to sort of also think about is deviating from the kind of traditional one perspective of history, but really telling it from a multiplicity kind of platform, and thinking about how, you know, being able to, in a visual narrative, bring several voices to the surface to allow that story to be told. So Esteban, along with our researchers, were an important part of that element. So here's a great photo of that context. And then really kind of thinking about this later model… I guess, if this will work. Let's see if this works. Let's see, maybe if I hit this. Woops. It's a video….There we go. Is it going? Oh. Well, all right. That's okay. That's what happens when you work in Macs and you transfer it over to PowerPoint.
But anyway, so we developed a model to look at the community. We broke it up into six layers. We were looking at culture, we were looking at the economy, we were looking at the infrastructure, the built environment, and also the culture. And so in there, there were also sublayers that we were very interested in looking at, you know, how you look at the architecture, you know. In particular, like a place, Embudo, there was a heavy presence of Catholicism and what that had in terms of the evolution of the community, and really the infrastructure in terms of manmade and natural infrastructure. Those are the things that we started to look at in terms of trying to break this down into a new model and then ultimately moving it into Google Earth. Like I said, it was an emergent platform in that time and it had a very robust kind of capacity.
We started to build this into a model where you can turn off and turn off layers and being able to understand, you know, the kind of physical context, but also being able to bring it into a different kind of environment where we would control it in a kind of Flash-based environment, so you could actually turn on and turn off layers. And so originally, when we set up the platform, we had something that would be community-based that'll allow inhabitants of the community to upload data into our repository, and then something that was maybe more of a kind of academic sort of component that we would control and try to merge it together into telling this historical evolution.
So then we started to look at, you know, the different sort of visuals that we could acquire in all the archives around the state. So here, you can start to see the breakdown of the different aerials and maps that we were able to find over time. This is just it being populated geospatially in Google Earth. This is one of the earlier maps that start to breakdown the kind of partitions of land. Some of the aerials over time. It was really interesting in kind of looking at these. What we noticed in just looking at the aerials, that the land actually got wider. We were kind of curious about that, so we actually were talking to Esteban and one of the reasons is that the tractor around the 1940s actually came into play and it actually increased the size of plots of land. That was a really interesting kind of observation that came out of looking at the aerials.
Ultimately, the Virtual Embudo Project became the Virtual New Mexico Project. We got funding to move into another context and we started to look at going to Santa Rosa. I worked with Chris Wilson, the Historic Preservation Director at the time at UNM, and he was very interested in taking this model and using it at a Historical Preservation class. I had the great opportunity to work with a couple of other professors, Enrique Lamadrid and Miguel Gandert. And it created a new environment. And that's actually when I first met Adriane, so I'm going to let Adriane talk a little bit about when she stepped into this project and some of the things that we did in terms of moving from maybe a static, kind of, mapping, kind of, tool into something that was much more visually a motion narrative.
Adriane Zacmanidis:
So moving into Santa Rosa, we brought this out of the Google Earth platform and into an ethnographic research model. Previous, we were really coming at it from an architectural pedagogy and now we're starting to bring in the ethnography as well, and starting to break down the systems in, sort of, a more specific way. And so this was a week-long Historic Preservation intensive class. It lasted the summer though and what I mean by that is that the students were on the ground for the week, and then they had two months after that to complete the project.
What we did at this time was, working with Enrique Lamadrid who is an ethnographer, and Miguel Gandert, who is a photographer, we started to take the ethnography into a video narrative platform, which we thought would become more accessible to the communities that we were trying to reach with this information because as Tim said, from the very beginning of this project, this wasn't just for the ivory tower research. This was really for the communities that we were working in as well, so that they could look at their morphology of place, look at their history of time, and understand maybe ways to move their communities forward.
And so the students were really allowed to create their own research and interpretation of the story of place in Santa Rosa. What came out of it were some extraordinary videos ranging from narratives that were basic oral histories to short almost what you would call an informational video about the history of the place and economic development. One of our students came from the MainStreet Program here in New Mexico.
Adriane Zacmanidis:Anyway, she did a great video around economic development for Santa Rosa. Some other people focused on the water issues in Santa Rosa. This allowed us to bring our model, as I say, out of that strict architectural pedagogy and those layers of just building 3D representations of the morphology of place over time into bringing narrative community member's voice, community member's memories into the place. This brings us into knowing your audience. And so I've worked for many years with museums in interpretation and in exhibit design, so when I came on, we really started to look at who the audience was for this research.
As I say, from the get-go, Tim and Dean Forbes didn't want this to be just for the ivory tower, really wanted to bring it out into the community. We started looking at ways in which we could disperse this information out into the communities. And what we realized was that we needed to use a website. Google Earth became a problem because people had to download Google Earth and then understand how to work Google Earth. Once we were able to put these short Google Earth videos into a website or into a video narrative, then it became much more accessible.
We were also interested in starting to use this information for K through 12 education in the state, and that's something that we're still working towards. All of that to say, knowing your audience, starting with user experience very early on, and understanding what our limitations are and what the public's limitations are with connecting with that research and connecting with systems thought and systems based materials was very important to us.
Tim Castillo: In terms of applying this model elsewhere, we subsequently have gotten funding to move to Silver City, so we're really interested in different types of economic engines across the state. So he agrarian community, Santa Rosa was a kind of ranching community, and then moving down south to a place like Silver City, that's a mining community. So what you see here on the right, or my right, is the town and actually the open pit mine. They're actually to scale, so you can actually see the vastness of that mine. And really, what we're interested in is also creating visualizations that start to talk about the kind of growth over time. As the mine grows, the town also starts to show that growth. We're interested in that kind of collaboration.
This is a video you're not going to be able to see, unfortunately. But we started to, we had a graduate student that was working with us, and we were able to start to create these animated system maps, and so coming back to the idea of visualization, and really allowing a community to understand the many layers. I mean I think they become self-evident if you're in that community, but sometimes it's informative to understand the complexity that comprises each community.
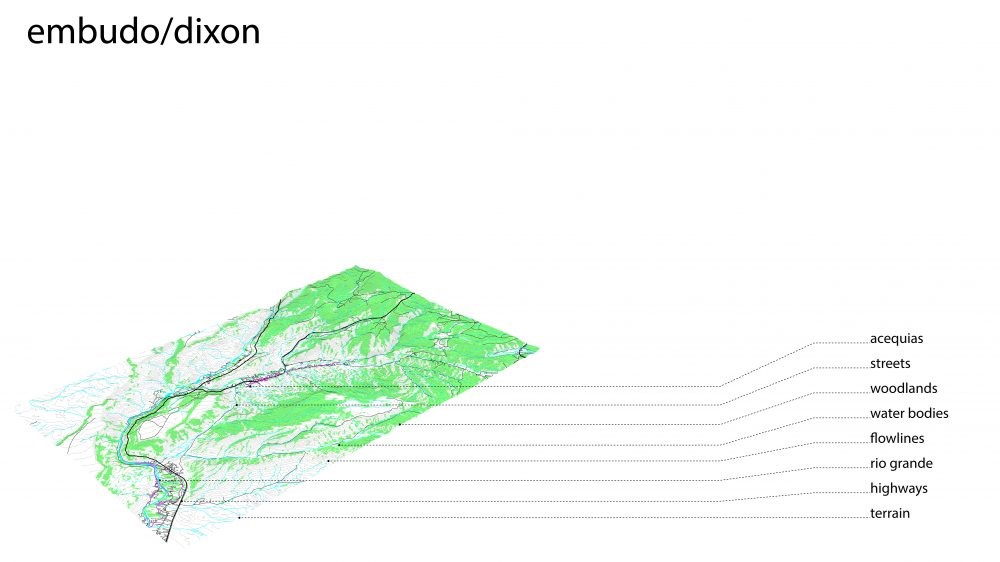
So we went back, using this methodology to be able to articulate the different kinds of areas that we were focusing on, so really again looking at a visualization and its capacity to tell stories. One of things that we found is that we're trying to stimulate people not necessarily in a way that maybe is intriguing. So one of the things that we really started to move into, is into the idea of cinema, and really that YouTube format is a very productive format as a threshold into research. It's almost the ... If you look at the metrics, YouTube has the highest metrics in terms of social media. And so we thought, we've got to move into that domain so that becomes our threshold, our doorstep into the rest of the research. So it becomes a way of a calling card.
So we started to create these animations as a way of really calling into play the different work. As we moved on in moving into different tools, coming back into that kind of iterative process that we learned in architectural pedagogy, we're very interested in looking at new tools. We know over time ... We had been looking at the New York Times model of visualization. If you're aware of what's going on in terms of that model, it's been a very productive model. It's very consumer base, but can be very saturated with high content. The Story Maps model that came out a couple years ago is a great model that basically works in the GIS format.
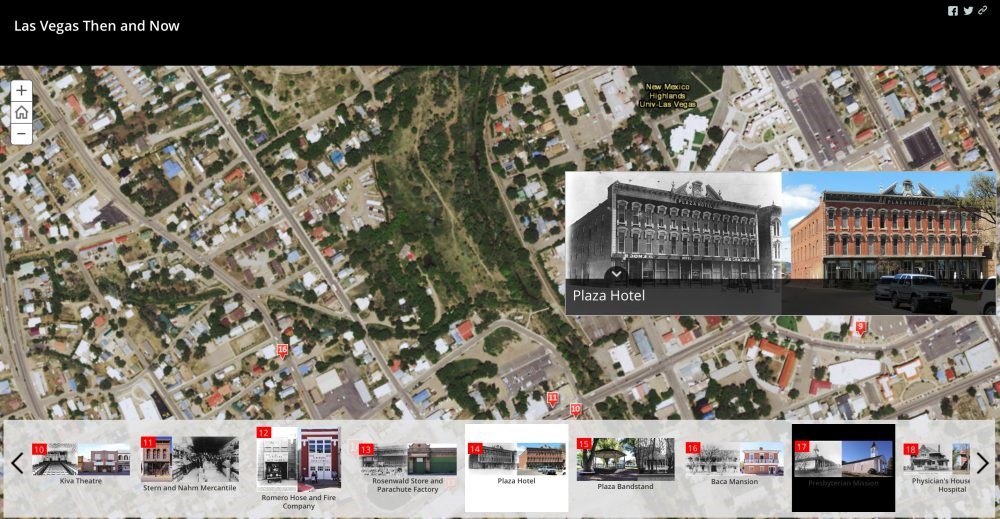
And so we had one of our research students, a landscape architect, start to look at Las Vegas, New Mexico. That's our new community that we've been really researching and really coming back to the kind of architectural built environment context and looking at the before, or the then and now kind of photographs and be able to allow that user interface to be interactive and hopefully user friendly enough so that people can actually be able to access it. So Adriane, I don't know if you wanted to elaborate on that a little bit more.
Adriane Zacmanidis:
One of the things that I want to just reiterate on and push home is that this is really, truly an interdisciplinary project at the University of New Mexico, as well as working with the communities closely on the ground. And so for Las Vegas specifically, we worked with the Historic Preservation group there that is quite active and quite strong. They were helping us, every step of the way, gather materials for this because they understood the implications of getting this information out there, and again visually stating that morphology of place and the necessity of preservation in their community.
And we were also always, because we're a research institute, we're also always pushing the boundaries. We're able to make mistakes. Like Julie was talking about earlier, we're not consultants coming in. We're able to go back to our lab at the university, work with this type of technology, push the boundaries, and make some mistakes. And so with Esri, not that we were making mistakes with this necessarily, but we were pushing the boundaries of this, just seeing how we could fit our research into this and could it hold it, would it hold it, and how would it translate to the community? And so with that said, then we moved into looking at more, or then we move into looking at more emergent tools and how those emergent tools can work for us in this type of research. I'll let Tim expand on that.
Tim Castillo: We got a grant this summer and really a lot of this funding, it comes directly from the Center for Regional Studies which is a granting agency at the University of New Mexico. We had this great idea of moving into ... Everybody's talking about VR right now. And so we at the lab, we purchased six Oculus Rifts. We really wanted to test the potential of what this 360 degree VR world would look like. We went back to the communities that we had been working in and we basically documented multiple sites in 360. What's really great about this is, is that is gives you ... It's much like that Street View in Google Earth where you can get that context, but now what we're doing is actually layering metadata onto these 360 degree images. Right here is Albuquerque Plaza in Old Town. So if you wanted to find information on the church, you would click on that image and then it would take you into another 360 inside the church and then you can actually get data about when it was built, its historical evolution. It's really an interesting tool for talking about place.
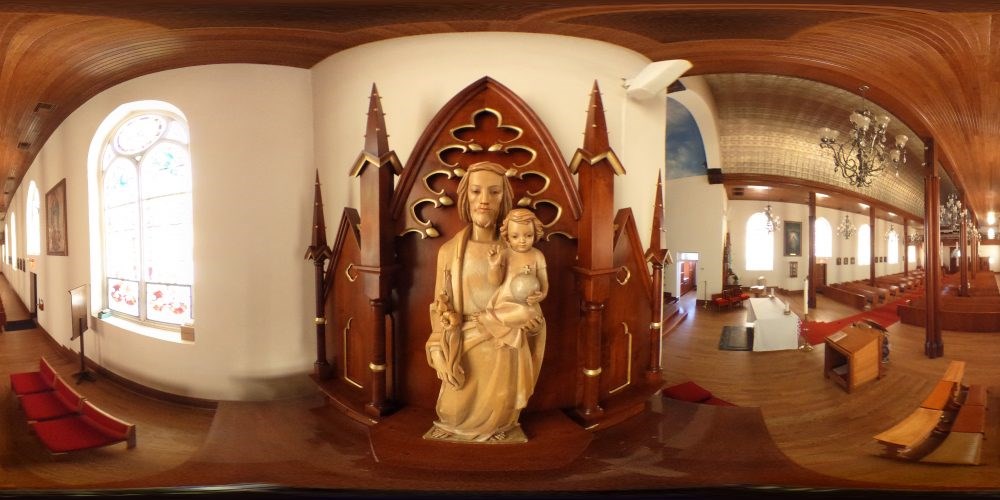
It's one that we're, like I said, like Adriane was talking ... We have the liberty to test these things and really try to understand its potential. I think right now, we're in the process of really trying to understand this. One of the difficulties about this technology is that, well, not everybody has an Oculus Rift. Well, with the VR technology, you can actually put it on the web and be able to have accessibility. That actually has great promise. The other thing is that, you know, you can create these Google Cardboards and use your Smartphones as a way of getting that immersive quality. Those are the things that we're very interested its potential and really layering it back into our existing VNMP model.
In terms of limitations - this is a video that you're not going to see …It's basically ... It kind of goes, yeah ...This is really a trailer and again, coming back to the idea of YouTube, it's a really poetic thing. We purchased some drones a couple years ago, and so we've been able to go in and drone these environments, and we've put this really fantastic, beautiful composition about all the communities that we're in. It's really, again, like I said, it's that threshold. It's really that door, that threshold into our research to stimulate the students.
Like Adriane was saying, we love ... My dream is for this to be the way that kids in the state of New Mexico learn about the history of New Mexico, so being able to populate this in their tablets, into their computers, and, you know, having this interactive platform, is really kind of a goal that we're trying to strive for. In terms of limitations, again, it's funding. Funding is everything. Being able to carry something like this forward takes a tremendous amount of resources. We don't get to all the layers that we want to in the communities because we run out of time, we run out of money, but at the same time, we're also running up against limitations about technology. Like in transitions into Google Earth, we've seen over the last six years that Google Earth has actually become more imploded and more closed down. The things we could do eight years ago, you can't do anymore.
You've got to roll with the technology, but again, like the Esri model, that's a new opportunity that we're expanding on. And so we're constantly being malleable and really trying to roll with the times, but at the end of the day, we have this catalog of information that is robust and we think that it has great potential. So just in terms of conclusion, I think that we're very excited about what we're doing here at the University of New Mexico but in terms of our region, documenting the people and place, but also taking this into a more global kind of context. And so one of the things that we're very excited about is working with Julie this next year to actually look at this model in the parks across the region and really starting to think about how that evolves over time. Adriane, do you have a couple more ...
Adriane Zacmanidis:
[inaudible 00:26:01].
Tim Castillo: Yeah and specifically Bandelier, this next year will be where we'll be spending a majority of our time. So thank you very much.
Last updated: April 7, 2025
