Article

Modeling Past and Future Soil Moisture in Southern Colorado Plateau National Parks and Monuments

In the semi-arid environment of the Colorado Plateau, soil moisture is an important driver of vegetation growth. The recent drought-related die-off of trees across the Southwest has highlighted how ecosystems may be vulnerable to changes in available water. Climate change models predict drier conditions over the next century.

How will these changes affect vegetation in these already dry ecosystems? The Southwest Biological Science Center of the U.S. Geological Survey (USGS) and the Southern Colorado Plateau Network of the National Park Service (NPS) have teamed up to answer this question. They used soil and vegetation data from ecosystems in nine network parks to model soil moisture under predicted climate conditions.

Their results predicted the drying of soils in spring would occur earlier in both the near term (2020-2059) and long term (2060-2099) future. This will shorten the time when soils are moist during the spring growing season. As a result, plant species that rely on soil moisture in the spring may be at higher risk due to drought. But this is only part of the story. The Colorado Plateau supports hundreds of species of plants, mammals, birds, reptiles and insects. How will wildlife respond to changes in their habitat? As we continue to collect data and improve modeling and other methods of analysis, we can learn more about the effects of climate change on arid ecosystems. With this knowledge, scientists can work on developing strategies that seek to improve long-term ecosystem resistance and resilience, thus, helping to preserve our parks for future generations.
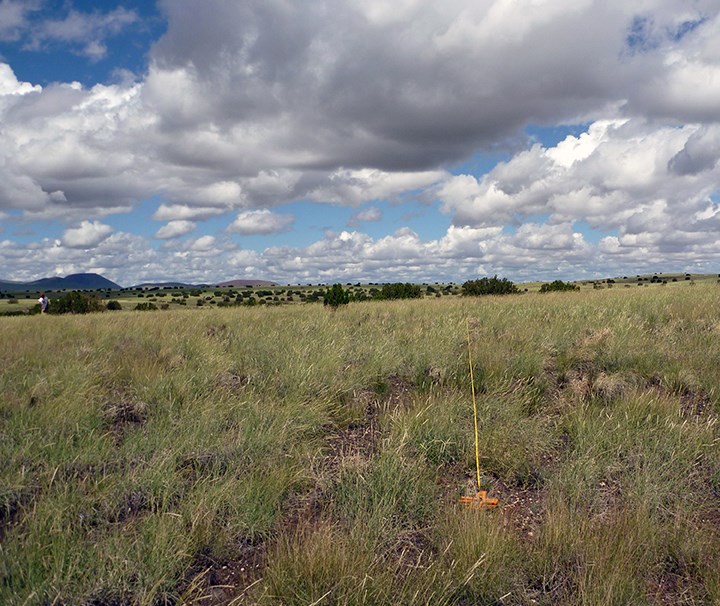
Photo of a grasslands landscape with shrubs in the background and mountains in the distance. Sky is full of fluffy clouds. Measuring tape is in the foreground.
Volcanic upland grassland ecosystem in Wupatki National Monument. Researchers modeled past and  future soil  moisture in this and 8 other national parks in the Southern Colorado Plateau Network.

NPS

Introduction

For this project, USGS and NPS scientists compared historical and predicted future climate data for nine Southern Colorado Plateau Network parks. They put this information into SoilWat2, a soil water model that takes information on soils and climate and translates it into an estimate of soil water availability. This estimate, or soil water potential (SWP), tells us how much water is available to plants for growth and survival.

Scientists determined SWP at 2 depths for each ecosystem: intermediate (20-50 cm) and deep (50-100 cm). They also looked at the amount of vegetation greenness, which represents plant growth, using satellite imagery over a 15-year period. For each grassland and shrubland ecosystem, they compared the SWP at both depths with the amount of greenness during a particular season. The depth at which SWP best correlated with plant growth represents the SWP that is most relevant to the dominant plants in each ecosystem. Results using this depth are presented in this report. For more details, please see the Methods section and the Natural Resource Report for each park ecosystem.

This article presents the following information for 13 ecosystems in nine national park units in the Southern Colorado Plateau Network of the National Park Service.

  • results of modeled current and future SWP
  • current and predicted future climate
  • relationship of NDVI to soil water potential (grassland and shrubland ecosystems only)

Methods

1. Data were collected from the following sources for input into the SoilWat2 model:

  • Texture and depth data from soil core samples that were taken during the establishment of SCPN upland monitoring plots (supplemented with soil texture data from soil surveys when the soil cores did not extend to the full depth of the soil profile).
  • Vegetation species and functional group cover data from SCPN monitoring plots
  • Daily weather data estimates (long-term historical weather) from 1920 to 2011 (Livneh et al. 2013)
  • Projected daily weather for the periods 2020–2059 and 2060–2099. All projected climate data was downloaded from the Green Data Oasis.

2. SoilWat2 integrated these climate data, along with the soils and vegetation data, to generate the following simulations:

  • long term historical daily soil water potential (1915-2010)
  • near term historical daily soil water potential (1980-2015)
  • near term future daily soil water potential (2020-2059)
  • long term future daily soil water potential (2060-2099)

We used box plots to represent annual variation in each of the seasonal soil moisture projections for the respective time periods. For future time periods, we used the mean projected soil moisture. The SoilWat 2 model, along with the soil moisture simulations, is available at https://doi.org/10.5066/F7D50K6S.

3. Normalized difference vegetation index (NDVI) was generated bi-weekly from 2000-2014 using a neighborhood analysis of MODIS data. NDVI is an indicator of plant productivity and represents phenological timing in vegetation communities. NDVI ranges from 0 (low productivity) to 1 (high productivity). Recent work has found NDVI to be an unreliable tool in pinyon-juniper ecosystems (Norris and Walker, in review), so the NDVI-related analyses were not performed for the pinyon juniper ecosystems at GRCA, MEVE, or BAND.

4. We calculated annual NDVI by integrating the area under the NDVI curve as a representative measure of total annual productivity. Annual NDVI was then correlated with SWP averaged over windows ranging from 10 to 365 days throughout the year. This method of analysis allows us to look at the impact of timing and duration of water availability on annual NDVI.

Results

Present and future climate and soil moisture, and the relationship with NDVI for 13 ecosystems in nine SCPN national park units are presented here.

Landscape with shrubs in the foreground and hills in the background under a blue sky with a few scattered clouds.
Figure AL-1. Limy upland shrubland ecosystem in Aztec Ruins National Monument.

NPS

Study Area: Limy Upland Shrubland Ecosystem in Aztec Ruins National Monument, New Mexico

The limy upland shrubland ecosystem in Aztec Ruins National Monument (Figure AL-1) consists of a mix of low shrubs, grasses and forbs with scattered overstory junipers. Common species include big sagebrush (Artemisia tridentata), galleta grass (Hilaria jamesii), snakeweed (Gutierrezia sarothrae), and Opuntia spp. Soils in this ecosystem are typically classified as loam. We used data from soil cores taken from six plots in this ecosystem as inputs to the SoilWat2 model.

The outputs from our model show soil water potential (SWP) for the past, present, and future, and highlight relatively moist and dry periods. Here we present seasonal and temporal patterns in soil water availability in the limy upland shrubland ecosystem in Aztec Ruins National Monument. 

Two part graph. Left: Line graph of soilwater potential by season (1920 to 2000). Seasons are: Fall/Winter, Spring and Summer.  Right: Box plot of soilwater potential by season for the current), near future and long-term future.
Figure AL-2: Historical (A) and future projections (B) of soil water potential (SWP) in the limy upland shrubland ecosystem in Aztec Ruins National Monument, New Mexico.

USGS

Figure AL-2 shows historical (A) and future projections (B) of SWP at intermediate soil depths (20–50 cm) in the limy upland shrubland ecosystem in Aztec Ruins NM for three seasons: fall/winter (October–February), spring (March–June), and summer (July–September). Panel A shows historical annual variability (fine lines) and moving 10-year averages (thick lines) of drying and wetting from 1915–2010. Panel B compares variability amongst years for three time periods, current (C; 1970–2010), near future (N; 2020–2059), and long-term future (L; 2060–2099), grouped by season.

3A-Current and predicted temperature and precipitation; 3B-Monthly mean for NDVI (2001–2014); 3C- periods when soil moisture is related to changes in vegetation productivity; 3D-Average daily SWP for the current period, near future, and long-term future.
Figure AL-3. Panel A - Seasonal climate patterns for Aztec Ruins NM; Panel B - monthly mean NDVI index; Panel C - correlations between NDVI and SWP; and Panel D - soil water potential (SWP) for current (1970-2010) and near (2020-2059) and long-term (2060-2099) future time periods.

USGS


In Figure AL-3, Panel A shows the average seasonal patterns of climate in the limy upland shrubland ecosystem in Aztec Ruins NM for the current (1970–2010), near future (2020–2059), and long-term future (2060–2099) periods. Panel B shows the monthly mean for the normalized difference vegetation index (NDVI, 2001–2014). Panel C indicates the seasonal periods when soil moisture is related to fluctuations in vegetation productivity, depicted by correlations between NDVI and SWP, 2001–2014. Panel D presents the average daily SWP for the current (1970–2010), near future (2020–2059), and long-term future (2060–2099) periods.


Key Findings

Key findings for the Aztec Ruins NM limy upland shrubland ecosystem include the following:

  • All of the climate models predicted increases in mean monthly and annual temperature in the near-term future (+2.4°C on average), and further increas­es in the long-term future (+5.2°C on av­erage). Future precipitation predictions were more variable, except for June, for which low precipitation is consistently predicted.
  • Future soil water availability is projected to decline, particularly in the spring. By the end of the 21st century, average spring soil water potential is expected to drop below -3.0 MPa, indicating condi­tions of extreme water scarcity.
  • The drying of soils in spring is predicted to occur earlier in both the near-term and long-term future, and will shorten the period when soils are moist dur­ing the spring growing season. This will likely have a substantial impact on plant species that rely on soil moisture during this time of year.
  • Productivity, as estimated by annual NDVI, is most strongly correlated to soil water potential in the mid to late spring, underscoring the importance of soil moisture during this time period.

The full Natural Resource Report, Describing Trends in Past and Future Soil Moisture in the Limy Upland Shrubland Ecosystem in Aztec Ruins National Monument, is available here.

Back to Results shortcuts

Pinyon-juniper woodland with grassy understory.
Figure BP-1. Mesa-top pinyon-juniper woodland ecosystem in Bandelier National Monument.

NPS

Study Area: Mesa-Top Pinyon-Juniper Woodland Ecosystem in Bandelier National Monument, New Mexico

In the mesa-top pinyon-juniper woodland ecosystem in Bandelier National Monument (Figure BP-1), the overstory ranges from a dense to sparse canopy of oneseed junipers (Juniperus monosperma). The understory is also variable; the most common understory species include grama grass (Bouteloua gracilis) and snakeweed (Gutierrezia sarothrae). Soils in this ecosystem are typically classified as sandy loam. We used data from soil cores taken from 47 plots in this ecosystem as inputs to the SoilWat2 model.

The outputs from our model show soil water potential (SWP) for the past, present, and future, and highlight relatively moist and dry periods. Here we present seasonal and temporal patterns in soil water availability in the mesa-top pinyon-juniper woodland ecosystem in Bandelier National Monument (NM).

Two part graph. Left: Line graph of soilwater potential by season (1920 to 2000). Seasons are: Fall/Winter, Spring and Summer.  Right: Box plot of soilwater potential by season for the current), near future and long-term future.
Figure BP-2: Historical (A) and future projections (B) of soil water potential (SWP) in the mesa-top pinyon-juniper woodland ecosystem in Bandelier National Monument.

USGS

Figure BP-2 shows the historical (A) and future projections (B) of SWP at intermediate soil depths (20–50 cm) in the mesa-top pinyon-juniper woodland ecosystem in Bandelier NM for three seasons: fall/winter (October–February), spring (March–June), and summer (July–September). Panel A shows historical annual variability (fine lines) and moving 10-year averages (thick lines) of drying and wetting from 1915–2010. Panel B compares variability amongst years for three time periods, current (C; 1970–2010), near future (N; 2020–2059), and long-term future (L; 2060–2099), grouped by season.
Two panels showing climate and soil moisture patterns throughout an average year.
Figure BP-3. Panel A:Seasonal climate patterns for mesa-top pinyon-juniper woodlands in Bandelier National Monument; Panel B: Soil water potential (SWP) for current (1970-2010) and near (2020-2059) and long-term (2060-2099) future time period.

USGS


In Figure BP-3, Panel A presents average seasonal patterns of climate in the mesa-top pinyon-juniper woodland ecosystem in Bandelier NM for the current (1970–2010), near future (2020–2059) and long-term future (2060–2099) periods. Panel B shows average daily SWP for the current (1970–2010), near future (2020–2059), and long-term future periods (2060–2099).


Key Findings

Key findings for the Bandelier National Monument mesa-top pinyon-juniper woodland ecosystem include the following:

  • All of the climate models predicted increases in mean monthly and annual temperature in the near-term future (+2.3°C on average), and further increases in the long-term future (+4.9°C on average). Models had greater variation in their predictions of both the direction and the amount of future precipitation.

  • Soil moisture is predicted to decline in the spring in the near-term future. In the long-term future, soil moisture in the fall, winter, and spring is predicted to significantly decline.

  • The drying of soils in spring is predicted to occur earlier in the long-term future, and will shorten the length of time when soils are moist during the spring growing season. This will likely have a substantial impact on plant species reliant on spring soil moisture.

The full Natural Resource Report, Describing Trends in Past and Future Soil Moisture in the Mesa-Top Pinyon-Juniper Woodland Ecosystem in Bandelier National Monument, is available here.

Back to Results shortcuts

Expansive grassland under a blue sky with scattered clouds.
Figure CS-1. Sandy loam upland grassland ecosystem in Chaco Culture National Historical Park.

NPS

Study Area: Sandy Loam Upland Grassland Ecosystem in Chaco Culture National Historical Park

The sandy loam upland grassland ecosystem at Chaco Culture National Historical Park (NHP) (Figure CS-1) is dominated by blue grama (Bouteloua gracilis) and galleta grass (Hilaria jamesii), with scattered shrubs, including snakeweed (Gutierrezia sarothrae), four-wing saltbush (Atriplex canescens), and winterfat (Krascheninnikovia lanata). Soils in this ecosystem are typically classified as sandy clay loam. We used data from soil cores taken from 30 plots in this ecosystem as inputs to the SoilWat2 model.

The outputs from our model show soil water potential (SWP) for the past, present, and future, and highlight relatively moist and dry periods. These data can be considered in a variety of ways, including climate variability, variability among soil profiles, and relationships with plot-based vegetation monitoring data. Here we present seasonal and temporal patterns in soil water availability in the sandy loam upland grassland ecosystem in Chaco Culture NHP.

: Two part graph. Left: Line graph of soilwater potential by season (1920 to 2000). Seasons are: Fall/Winter, Spring and Summer. Right: Box plot of soilwater potential by season for the current), near future and long-term future.
Figure CS-2. Historical (A) and future projections (B) of soil water potential (SWP) in the sandy loam upland grassland ecosystem in Chaco Culture National Historical Park.

USGS

Figure CS-2 shows historical (A) and future projections (B) of SWP at intermediate soil depths (20–50 cm) in the sandy loam upland grassland ecosystem in Chaco Culture NHP for three seasons: fall/winter (October–February), spring (March–June), and summer (July–September). Panel A shows historical annual variability (fine lines) and moving 10-year averages (thick lines) of drying and wetting from 1915–2010. Panel B compares variability amongst years for three time periods, current (C; 1970–2010), near future (N; 2020–2059), and long-term future (L; 2060–2099), grouped by season.

A vertical series of 4 panels showing temperature and precipitation patterns, NDVI, the time of year when soil moisture is most strongly correlated to annual NDVI, and daily estimates of soil moisture throughout the year.
Figure CS-3. Panel A-Seasonal climate patterns for the sandy loam upland grassland ecosystem in Chaco Culture National Historical Park; Panel B-monthly mean NDVI index; Panel C-correlations between NDVI and SWP; and Panel D-soil water potential (SWP) for current (1970-2010) and near (2020-2059) and

USGS


In Figure CS-3, Panel A presents average seasonal patterns of climate in the sandy loam upland grassland ecosystem in Chaco Culture NHP for the current (1970–2010), near future (2020–2059), and long-term future (2060–2099) periods. Panel B shows the monthly mean for normalized difference vegetation index (NDVI, 2001–2014). Panel C shows the seasonal periods when soil moisture is related to fluctuations in vegetation productivity, depicted by correlations between NDVI and SWP, 2001–2014. Panel D presents average daily SWP for the current (1970–2010), near future (2020–2059), and long-term future (2060–2099) periods.


Key Findings

Key findings for the Chaco Culture NHP sandy loam upland grassland ecosystem include the following:

  • All of the climate models predicted increases in mean monthly and annual temperature in the near-term future (+2.4°C on average), and further increas­es in the long-term future (+5.1°C on average). Models had greater variation in their predictions of both the direction and the amount of future precipitation, particularly in the latter half of the year.

  • The drying of soils in spring is predicted to occur earlier, particularly in the long-term scenario, and will shorten the period when soils are moist during the spring growing season. This will likely have a substantial impact on plant spe­cies that rely on soil moisture during this time of year.

  • Productivity, as estimated by annual NDVI, is most strongly correlated to soil water potential in mid-spring, underscoring the importance of soil moisture during this time period.

The full Natural Resource Report, Describing Trends in Past and Future Soil Moisture in the Sandy Loam Upland Grassland Ecosystem in Chaco Culture National Historical Park is available here.

Back to Results shortcuts

Sandy shrubland with mountains in the distance
Figure GB-1. Desert sand shrubland ecosystem in the Bullfrog region of Glen Canyon National Recreation Area.

NPS

Study Area: Desert Sand Shrubland Ecosystem, Bullfrog Region of Glen Canyon National Recreation Area.

The desert sand shrubland ecosystem in the Bullfrog Region of Glen Canyon National Recreation Area (NRA)(Figure GB-1) is generally characterized by sand-loving forbs like sand verbena (Abronia fragrans), and diverse shrubs such as Mormon-tea (Ephedra spp.), indigo bush (Psorothamnus fremontii), and sandsage (Artemisia filifolia). Soils in this ecosystem are typically classified as sandy. Another location where the desert sand shrubland ecosystem is monitored in Glen Canyon NRA is in the Escalante region, which is addressed separately. We used data from soil cores taken from six plots in the desert sand shrubland ecosystem as inputs to the SoilWat2 model.

The outputs from our model show soil water potential (SWP) for the past, present, and future, and highlight relatively moist and dry periods. These data can be considered in a variety of ways, including climate variability, variability among soil profiles, and relationships with plot-based vegetation monitoring data. Here we present seasonal and temporal patterns in soil water availability for the desert sand shrubland ecosystem in the Bullfrog region of Glen Canyon NRA.

Figure 3. Left panel is a line plot showing soil moisture through time with a line for each season. Right panel contains boxplots showing how seasonal moisture is predicted to change from the current levels to the near term and long term future.
Figure GB-2. Historical (A) and future projections (B) of soil water potential (SWP) in the desert sand shrubland ecosystem in the Bullfrog region of Glen Canyon NRA.

NPS

Figure GB-2 shows historical (A) and future projections (B) of SWP at intermediate soil depths (20–50 cm) in the desert sand shrubland ecosystem in the Bullfrog region of Glen Canyon NRA for three seasons: fall/winter (October–February), spring (March–June), and summer (July–September). Panel A shows historical annual variability (fine lines) and moving 10-year averages (thick lines) of drying and wetting from 1915–2010. Panel B compares variability amongst years for three time periods, current (C; 1970–2010), near future (N; 2020–2059), and long-term future (L; 2060–2099), grouped by season.

- 3A-Current and predicted temperature and precipitation; 3B-Monthly mean for NDVI (2001–2014); 3C- periods when soil moisture is related to changes in vegetation productivity; 3D-Average daily SWP for the current period, near future, and long-term future
Figure GB-3. Panel A-Seasonal climate patterns for the desert sand shrubland ecosystem in Glen Canyon NRA, Bullfrog; Panel B-monthly mean NDVI index; Panel C-correlations between NDVI and SWP; Panel D-soil water potential for current (1970-2010) and near (2020-2059) and long-term (2060-2099) future.

USGS


Figure GB-3. Panel A. Average seasonal patterns of climate in the desert sand shrubland ecosystem in the Bullfrog region of Glen Canyon NRA for the current (1970–2010), near future (2020–2059), and long-term future (2060–2099) periods. Panel B presents the monthly mean for normalized difference vegetation index (NDVI, 2001–2014). Panel C shows seasonal periods when soil moisture is related to fluctuations in vegetation productivity, depicted by correlations between NDVI and SWP, 2001–2014. Panel D shows average daily SWP for the current (1970–2010), near future (2020–2059), and long-term future (2060–2099) periods.

Key Findings

Key findings for the Bullfrog region of Glen Canyon NRA desert sand shrubland ecosystem include the following:

  • All of the climate models predicted increases in mean monthly and annual temperature in the near-term future (+2.4°C on average), and further increas­es in the long-term future (+5.1°C on average). Models had greater variation in their predictions of both the direction and the amount of future precipitation, particularly in the late summer and fall.
  • Future soil water availability is projected to decline for all seasons under both the near and long-term scenarios. The largest decreases in soil moisture are ex­pected in the fall/winter and spring. Fall/winter soil water potential is expected to approach -3.0MPa, indicating conditions of extreme water scarcity. Predictions of soil moisture for both the near and long-term future are very similar, suggesting that the worst effects of decreasing soil moisture may be felt in the near-term future.
  • The drying of soils in spring is predicted to occur earlier, and will shorten the pe­riod when soils are wet during the winter and spring growing season. This will likely have a substantial impact on plant species that rely on this soil moisture.

The full Natural Resource Report, Describing Trends in Past and Future Soil Moisture in the Desert Sand Shrubland Ecosystem in the Bullfrog Region of Glen Canyon National Recreation Area, is available here.

Back to Results shortcuts

Large expanse of sandy shrubland with mountains in the distance.
Figure GH-1. Desert sand shrubland ecosystem in the Escalante region of Glen Canyon National Recreation Area.

NPS

Study Area: Desert Sand Shrubland Ecosystem, Escalante Region, Glen Canyon National Recreation Area.

The desert sand shrubland ecosystem in the Escalante region of Glen Canyon National Recreation Area (NRA)(Figure GH-1) is generally characterized by diverse shrubs, including Mormon-tea (Ephedra spp.), Fremont’s indigo bush (Psorothamnus fremontii), blackbrush (Coleogyne ramosissima), and sandsage (Artemisia filifolia). Soils in this ecosystem are typically classified as sandy. Another location where the desert sand shrubland ecosystem is monitored in Glen Canyon NRA is in the Bullfrog region, which is addressed separately. We used data from soil cores taken from ten plots in the desert sand shrubland ecosystem as inputs to the SoilWat2 model.

The outputs from our model show soil water potential (SWP) for the past, present, and future, and highlight relatively moist and dry periods. These data can be considered in a variety of ways, including climate variability, variability among soil profiles, and relationships with plot-based vegetation monitoring data. Here we present seasonal and temporal patterns in soil water availability for the desert sand shrubland ecosystem in the Escalante region of Glen Canyon NRA.

Two part graph. Left: Line graph of soilwater potential by season (1920 to 2000). Seasons are: Fall/Winter, Spring and Summer. Right: Box plot of soilwater potential by season for the current), near future and long-term future.
Figure GH-2. Historical (A) and future projections (B) of soil water potential (SWP) in the desert sand shrubland ecosystem in the Escalante region of Glen Canyon NRA.

USGS

Figure GH-2 shows historical (A) and future projections (B) of SWP at intermediate soil depths (20–50 cm) in the desert sand shrubland ecosystem in the Escalante region of Glen Canyon NRA for three seasons: fall/winter (October–February), spring (March–June), and summer (July–September). Panel A shows historical annual variability (fine lines) and moving 10-year averages (thick lines) of drying and wetting from 1915–2010. Panel B compares variability amongst years for three time periods, current (C; 1970–2010), near future (N; 2020–2059), and long-term future (L; 2060–2099), grouped by season.

3A-Current and predicted temperature and precipitation; 3B-Monthly mean for NDVI (2001–2014); 3C- periods when soil moisture is related to changes in vegetation productivity; 3D-Average daily SWP for the current period, near future, and long-term future.
Figure GH-3. Panel A-Seasonal climate patterns for desert sand shrubland in Glen Canyon NRA, Escalante region; Panel B-monthly mean NDVI index; Panel C-correlations between NDVI and SWP; Panel D-soil water potential (SWP) for current (1970-2010) and near (2020-2059) and long-term (2060-2099) future.

USGS


In Figure GH-3, Panel A shows average seasonal patterns of climate in the desert sand shrubland ecosystem in the Escalante region of Glen Canyon NRA for the current (1970–2010), near future (2020–2059), and long-term future (2060–2099) periods. Panel B presents the monthly mean for normalized difference vegetation index (NDVI, 2001–2014). Panel C shows seasonal periods when soil moisture is related to fluctuations in vegetation productivity, depicted by correlations between NDVI and SWP, 2001–2014. Panel D shows average daily SWP for the current (1970–2010), near future (2020–2059), and long-term future (2060–2099) periods.


Key Findings

Key findings for the Escalante region of Glen Canyon NRA desert sand shrubland ecosystem include the following:

  • All of the climate models predicted increases in mean monthly and annual temperature in the near-term future (+2.5°C on average), and further increas­es in the long-term future (+5.1°C on average). Models had greater variation in their predictions of both the direction and the amount of future precipitation.

  • Future soil water availability is predicted to remain similar in the near-term sce­nario, but to decrease significantly in the long-term, particularly in the fall/winter and spring seasons.

  • The drying of soils in spring is pre­dicted to occur earlier in the long-term scenario, and will shorten the period when soils are wet during the winter and spring growing season. This will likely have a substantial impact on plant spe­cies that rely on spring soil moisture.


The full Natural Resource Report, Describing Trends in Past and Future Soil Moisture in the Desert Sand Shrubland Ecosystem in the Escalante Region of Glen Canyon National Recreation Area, is available here.

Back to Results shortcuts

A woodlan of mostly pinyon and some juniper trees.
Figure GP-1. Pinyon-juniper woodland ecosystem in Grand Canyon National Park.

NPS

Study Area: Pinyon-Juniper Woodland Ecosystem in Grand Canyon National Park

The pinyon-juniper woodland ecosystem in Grand Canyon National Park (NP) (Figure GP-1) is characterized by a dense pinyon-juniper overstory with understory shrubs including Stansbury cliffrose (Purshia stansburiana) and big sagebrush (Artemisia tridentata). Perennial grasses, forbs and cacti are also represented. Soils in this ecosystem are typically classified as clay loam. We used data from soil cores taken from 22 plots in this ecosystem as inputs to the SoilWat2 model.

The outputs from our model show soil water potential (SWP) for the past, present, and future, and highlight relatively moist and dry periods. These data can be considered in a variety of ways, including climate variability, variability among soil profiles, and relationships with plot-based vegetation monitoring data. Here we present seasonal and temporal patterns in soil water availability in the pinyon-juniper woodland ecosystem at Grand Canyon NP.

Two part graph. Left: Line graph of soil water potential by season (1920 to 2000). Seasons are: Fall/Winter, Spring and Summer. Right: Box plot of soilwater potential by season for the current), near future and long-term future.
Figure GP-2. Historical (A) and future projections (B) of soil water potential (SWP) in the pinyon-juniper woodland ecosystem at Grand Canyon National Park.

USGS

Figure GP-2 presents historical (A) and future projections (B) of SWP at intermediate soil depths (20–50 cm) in the pinyon-juniper woodland ecosystem in Grand Canyon NP for three seasons: fall/winter (October–February), spring (March–June), and summer (July–September). Panel A shows historical annual variability (fine lines) and moving 10-year averages (thick lines) of drying and wetting from 1915–2010. Panel B compares variability amongst years for three time periods, current (C; 1970–2010), near future (N; 2020–2059), and long-term future (L; 2060–2099), grouped by season.

A vertical series of 2 line charts, with panel A (top) showing current and future climate patterns and panel B showing daily estimate of soil moisture for an average year.
Figure GP-3. Panel A-Seasonal climate patterns for the pinyon-juniper woodland ecosystem in Grand Canyon NP. Panel B shows soil water potential (SWP) for current (1970-2010) and near (2020-2059) and long-term (2060-2099) future time period.

USGS


In Figure GP-3, Panel A shows seasonal climate patterns for the pinyon-juniper woodland ecosystem in Grand Canyon NP for the current (1970–2010), near future (2020–2059) and long-term future (2060–2099) periods. Panel B shows SWP for the current (1970-2010) and near (2020-2059) and long-term (2060-2099) future time period.


Key Findings

Key findings for the Grand Canyon NP pinyon-juniper woodland ecosystem include the following:

  • All of the climate models predicted increases in mean monthly and annual temperature in the near-term future (+2.5°C on average), and further increas­es in the long-term future (+5.0°C on average). Models had greater variation in their predictions of both the direction and the amount of future precipitation, except for the late spring months, for which low precipitation is consistently predicted.

  • Future soil water availability is projected to decline in the fall/winter and spring. By the end of the 21st century, average spring soil water potential is expected to drop below -3.0MPa, indicating condi­tions of extreme water scarcity.

  • The drying of soils in spring is predicted to occur earlier in both near and long-term scenarios, and will shorten the pe­riod when soils are wet during the spring growing season. This will likely have a substantial impact on plant species that rely on spring soil moisture.


The full Natural Resource Report, Describing Trends in Past and Future Soil Moisture in the Pinyon-Juniper Woodland Ecosystem in Grand Canyon National Park, is available here.

Back to Results shortcuts

Pinyon-juniper woodland under a blue sky.
Figure ML-1. Loamy mesa-top pinyon-juniper woodland ecosystem in Mesa Verde National Park

NPS

Study Area: Loamy Mesa-Top Pinyon-Juniper Woodland Ecosystem in Mesa Verde National Park

The loamy mesa-top pinyon-juniper woodland ecosystem in Mesa Verde National Park (NP) (Figure ML-1) is characterized by a dense pinyon-juniper (Pinus edulis-Juniperus spp.) overstory and an understory dominated by muttongrass (Poa fendleriana) and antelope bitterbrush (Purshia tridentata). Forbs and cacti are also present. Soils in this ecosystem are typically classified as clay loam. A second ecosystem that the Southern Colorado Plateau Network monitors in Mesa Verde NP is the shallow loamy mesa-top pinyon-juniper woodland, which is addressed in a separate brief. We used data from soil cores taken from 31 plots in the pinyon-juniper mesa-top woodland ecosystem as inputs to the SoilWat2 model.

The outputs from our model show soil water potential (SWP) for the past, present, and future, and highlight relatively moist and dry periods. These data can be considered in a variety of ways, including climate variability, variability among soil profiles, and relationships with plot-based vegetation monitoring data. Here we present seasonal and temporal patterns in soil water availability in the loamy mesa-top pinyon-juniper woodland ecosystem in Mesa Verde NP.

Two part graph. Left: Line graph of soilwater potential by season (1920 to 2000). Seasons are: Fall/Winter, Spring and Summer. Right: Box plot of soilwater potential by season for the current), near future and long-term future.
Figure ML-2. Historical (A) and future projections (B) of soil water potential (SWP) in the loamy mesa-top pinyon-juniper woodland ecosystem in Mesa Verde National Park.

USGS

Figure ML-2 presents historical (A) and future projections (B) of SWP at intermediate soil depths (20–50 cm) in the loamy mesa-top pinyon-juniper woodland ecosystem in Mesa Verde NP for three seasons: fall/winter (October–February), spring (March–June), and summer (July–September). Panel A shows historical annual variability (fine lines) and moving 10-year averages (thick lines) of drying and wetting from 1915–2010. Panel B compares variability amongst years for three time periods, current (C; 1970–2010), near future (N; 2020–2059), and long-term future (L; 2060–2099), grouped by season.

Figure 4. A vertical series of 2 graphs showing (top) climate patterns and daily estimates of soil moisture throughout an average year, including high soil moisture in winter, dropping soil moisture in spring, and rising soil moisture later in summer.
Figure ML-3. Panel A-Seasonal climate patterns for the loamy mesa-top pinyon-juniper woodland ecosystem in Mesa Verde NP; Panel B -soil water potential (SWP) for current (1970-2010) and near (2020-2059) and long-term (2060-2099) future time period.

USGS


In Figure ML3, Panel A shows average seasonal patterns of climate in the loamy mesa-top pinyon-juniper woodland ecosystem in Mesa Verde NP for the current (1970–2010), near future (2020–2059) and long-term future (2060–2099) periods. Panel B shows the average daily SWP for the current (1970–2010), near future (2020–2059), and long-term future periods (2060–2099).


Key Findings

Key findings for the Mesa Verde NP loamy mesa-top pinyon-juniper woodland ecosystem include the following:

  • All of the climate models predicted increases in mean monthly and annual temperature in the near-term future (+2.5°C on average), and further increases in the long-term future (+5.2°C on average). Models had greater variation in their predictions of both the direction and the amount of future precipitation, except for June, for which low precipita­tion is consistently predicted.

  • Future soil moisture is predicted to be higher in January to March under both the near and long-term scenarios, due to the earlier onset of snowmelt. Under the long-term scenario, April to August is predicted to have lower soil moisture.

  • The drying of soils in spring is predicted to occur earlier during the long-term scenario, and will shorten the period when soils are moist during the spring growing season. This will likely have a substantial impact on plant species that rely on spring soil moisture.


The full Natural Resource Report Describing Trends in Past and Future Soil Moisture in the Loamy Mesa-Top Pinyon-Juniper Woodland Ecosystem in Mesa Verde National Park, is available here.

Back to Results shortcuts

Dense pinyon-juniper woodland with bare soils and gnarled tree trunks in the foreground.
Figure MS-1. The Shallow Loamy Mesa-Top Pinyon-Juniper Woodland ecosystem in Mesa Verde National Park.

NPS

Study Area: Shallow Loamy Mesa-Top Pinyon-Juniper Woodland Ecosystem in Mesa Verde National Park

The shallow loamy mesa-top pinyon-juniper woodland ecosystem in Mesa Verde National Park (NP) (Figure MS-1) is characterized by a dense pinyon-juniper (Pinus edulis-Juniperus spp.) overstory and an understory dominated by muttongrass (Poa fendleriana) and antelope bitterbrush (Purshia tridentata). Forbs and cacti are also present. Soils in this ecosystem are typically classified as a loamy. These shallow soils often occur on the mesa shoulders. The Southern Colorado Plateau Network also monitors the loamy mesa-top pinyon-juniper woodland ecosystem in the park, which is addressed separately. We used data from soil cores taken from ten plots in the shallow loamy mesa-top pinyon-juniper woodland ecosystem as inputs to the SoilWat2 model.

The outputs from our model show soil moisture potential (SWP) for the past, present, and future, and highlight relatively moist and dry periods. These data can be considered in a variety of ways, including climate variability, variability among soil profiles, and relationships with plot-based vegetation monitoring data. Here we present seasonal and temporal patterns in soil water availability in the shallow loamy mesa-top pinyon-juniper woodland ecosystem in Mesa Verde NP.

Two part graph. Left: Line graph of soilwater potential by season (1920 to 2000). Seasons are: Fall/Winter, Spring and Summer. Right: Box plot of soilwater potential by season for the current), near future and long-term future.
Figure MS-2. Historical (A) and future projections (B) of soil water potential (SWP) in the shallow loamy mesa-top pinyon-juniper woodland ecosystem in Mesa Verde National Park

USGS

Figure MS-2 presents historical (A) and future projections (B) of SWP at intermediate soil depths (20–50 cm) in the shallow loamy mesa-top pinyon-juniper woodland ecosystem in Mesa Verde NP for three seasons: fall/winter (October–February), spring (March–June), and summer (July–September). Panel A shows historical annual variability (fine lines) and moving 10-year averages (thick lines) of drying and wetting from 1915–2010. Panel B compares variability amongst years for three time periods, current (C; 1970–2010), near future (N; 2020–2059), and long-term future (L; 2060–2099), grouped by season.

A vertical series of 2 graphs showing (top) climate patterns and daily estimates of soil moisture throughout an average year.
Figure MS-3. Panel A-Seasonal climate patterns for the shallow loamy mesa-top pinyon-juniper woodland ecosystem in Mesa Verde NP; Panel B -soil water potential (SWP) for current (1970-2010) and near (2020-2059) and long-term (2060-2099) future time period.

USGS


In Figure MS-3, Panel A presents average seasonal patterns of climate in the shallow loamy mesa-top pinyon-juniper woodland ecosystem in Mesa Verde NP for the current (1970–2010), near future (2020–2059) and long-term future (2060–2099) periods. Panel B shows average daily SWP for the current (1970–2010), near future (2020–2059), and long-term future periods (2060–2099).


Key Findings

Key findings for the Mesa Verde NP shallow loamy mesa-top pinyon-juniper woodland ecosystem include the following:

  • All of the climate models predicted increases in mean monthly and annual temperature in the near-term future (+2.5°C on average), and further increas­es in the long-term future (+5.2°C on average). Models had greater variation in their predictions of both the direction and the amount of future precipitation, except for June, for which low precipita­tion is consistently predicted.

  • By the end of the 21st century, average spring soil water potential is expected to drop to approximately -3.0MPa, indicating conditions of extreme water scarcity. Soil moisture is also predicted to decrease from September through December.

  • The drying of soils in spring is predicted to occur earlier in both scenarios, and will shorten the period when soils are moist during the spring growing season. This will likely have a substantial impact on plant species that rely on spring soil moisture.

The full Natural Resource Report, Describing Trends in Past and Future Soil Moisture in the Shallow Loamy Mesa-Top Pinyon-Juniper Woodland Ecosystem in Mesa Verde National Park, is available here.

Back to Results shortcuts

Monitoring tape running through an expansive grassland
Figure PC-1. Clayey fan grassland ecosystem at Petrified Forest National Park, Arizona.

NPS

Study Area: Clayey Fan Grassland Ecosystem in Petrified Forest National Park, Arizona

Clayey fan grassland is one of two upland ecosystems that the Southern Colorado Plateau Network (SCPN) monitors at Petrified Forest National Park (NP) (Figure PC-1). This open grassland community is primarily dominated by the grass, alkali sacaton (Sporobolus airoides), and the shrub, four-wing saltbush (Atriplex canescens). Annual grasses and forbs are well represented in wet years. Soils in this ecosystem are typically classified as sandy clay loam. The other ecosystem monitored by SCPN is the sandy loam upland grassland, which is addressed separately. We used data from soil cores taken from 30 plots in the clayey fan grassland ecosystem as inputs to the SoilWat2 model.

The outputs from our model show soil water potential (SWP) for the past, present, and future, and highlight relatively moist and dry periods. Here we present seasonal and temporal patterns in soil water availability in the clayey fan grasslands ecosystem at Petrified Forest NP.

Panel A (left) shows historical spring, summer and fall/winter Soil Water Potential for clayey fan grasslands at Petrified Forest NP. Panel B shows current, near, and long-term future Soil Water Potential for the 3 seasons.
Figure PC-2: Historical (A) and future projections (B) of soil water potential (SWP) in the clayey fan grassland ecosystem at Petrified Forest National Park, Arizona.

USGS

Figure PC-2 presents historical (A) and future projections (B) of SWP at intermediate soil depths (20–50 cm) in the clayey fan grassland ecosystem in Petrified Forest NP for three seasons: fall/winter (October–February), spring (March–June), and summer (July–September). Panel A shows historical annual variability (fine lines) and moving 10-year averages (thick lines) of drying and wetting from 1915–2010. Panel B compares variability amongst years for three time periods, current (C; 1970–2010), near future (N; 2020–2059), and long-term future (L; 2060–2099), grouped by season.

Figure PC-3. (From top to bottom) Panel A - Seasonal climate patterns for Petrified Forest NP; Panel B-monthly mean NDVI index; Panel C-correlations between NDVI and SWP; Panel D-soil water potential (SWP) for current, near future, and long-term future.
Figure PC-3. Panel A - Seasonal climate patterns for Petrified Forest NP; Panel B - monthly mean NDVI index; Panel C - correlations between NDVI and SWP; and Panel D - soil water potential (SWP) for current (1970-2010) and near (2020-2059) and long-term (2060-2099) future time periods.

USGS


In Figure PC-3, Panel A presents average seasonal patterns of climate in the clayey fan grassland ecosystem in Petrified Forest NP for the current (1970–2010), near future (2020–2059), and long-term future (2060–2099) periods. Panel B shows the monthly mean for normalized difference vegetation index (NDVI, 2001–2014). Panel C shows seasonal periods when soil moisture is related to fluctuations in vegetation productivity, depicted by correlations between NDVI and SWP, 2001–2014. Panel D presents average daily SWP for the current (1970–2010), near future (2020–2059), and long-term future (2060–2099) periods.

Key Findings

Key findings for the Petrified Forest NP clayey fan grassland ecosystem include the following:

  • All of the climate models predicted increases in mean monthly and annual temperature in the near-term future (+2.3°C on average), and further increas­es in the long-term future (+4.9°C on average). Models had greater variation in their predictions of both the direction and the amount of future precipitation, especially during the summer and fall.

  • Future soil water availability is projected to decline significantly in fall, winter, and spring. By the end of the 21st century, average fall/winter soil water potential is expected to drop to approximately -3.0 MPa, indicating conditions of extreme water scarcity, and approaching condi­tions observed in the spring now. Spring soil water availability will likely be less than summer’s, a pattern observed inter­mittently throughout the 20th century.

  • The drying of soils in spring is predicted to occur dramatically earlier in the long-term scenario, and may eliminate the period when soils are moist during the spring growing season. This will likely have a substantial impact on plant species that rely on soil moisture during the spring.

  • Productivity, as estimated by annual NDVI, is most strongly correlated to soil water potential in early summer, under­scoring the importance of soil moisture during this time period.


The full Natural Resource Report, Describing Trends in Past and Future Soil Moisture in the Clayey Fan Grassland Ecosystem in Petrified Forest National Park, is available here.

Back to Results shortcuts


: Expansive grassland with bare ground visible under a blue sky with scattered clouds.
Figure PS-1. Sandy loam upland grassland ecosystem in Petrified Forest National Park.

NPS

Study Area: Sandy Loam Upland Grassland Ecosystem in Petrified Forest National Park

The sandy loam upland grassland ecosystem at Petrified Forest National Park (NP) (Figure PS-1) is characterized by blue grama (Bouteloua gracilis), galleta grass (Hilaria jamesii) and perennial dropseed (Sporobolus spp.). Scattered four-wing saltbush (Atriplex canescens) and other shrubs are present. Soils in this ecosystem are typically classified as ranging from sandy loam to sandy clay loam. The Southern Colorado Plateau Network also conducts long-term monitoring in the clayey fan grassland ecosystem in PEFO, which is addressed in a separate brief. We used data from soil cores taken from 30 plots in the sandy loam upland grassland ecosystem as inputs to the SoilWat2 model.

The outputs from our model show soil water potential (SWP) for the past, present, and future, and highlight relatively moist and dry periods. These data can be considered in a variety of ways, including climate variability, variability among soil profiles, and relationships with plot-based vegetation monitoring data. Here we present seasonal and temporal patterns in soil water availability in the sandy loam upland grassland ecosystem in Petrified Forest NP.

Historical (A) and future projections (B) of soil water potential (SWP) in the sandy loam upland grassland ecosystem in Petrified Forest National Park.
Figure PS-2. Historical (A) and future projections (B) of soil water potential (SWP) in the sandy loam upland grassland ecosystem in Petrified Forest National Park.

USGS

Figure PS-2 presents historical (A) and future projections (B) of SWP at intermediate soil depths (20–50 cm) in the sandy loam upland grassland ecosystem in Petrified Forest NP for three seasons: fall/winter (October–February), spring (March–June), and summer (July–September). Panel A shows historical annual variability (fine lines) and moving 10-year averages (thick lines) of drying and wetting from 1915–2010. Panel B compares variability amongst years for three time periods, current (C; 1970–2010), near future (N; 2020–2059), and long-term future (L; 2060–2099), grouped by season.

3A-Current and predicted temperature and precipitation; 3B-Monthly mean for NDVI (2001–2014); 3C- periods when soil moisture is related to changes in vegetation productivity; 3D-Average daily SWP for the current period, near future, and long-term future.
Figure GPS-3. Panel A-Seasonal climate patterns for sandy loam upland grassland ecosystem at Petrified Forest NP; Panel B-monthly mean NDVI index; Panel C-correlations between NDVI and SWP; ,Panel D-soil water potential for current (1970-2010) and near (2020-2059) and long-term (2060-2099) future.

USGS


In Figure PS-3, Panel A presents the average seasonal patterns of climate in the sandy loam upland grassland ecosystem in Petrified Forest NP for the current (1970–2010), near future (2020–2059), and long-term future (2060–2099) periods. Panel B shows monthly mean for normalized difference vegetation index (NDVI, 2001–2014); Panel C shows seasonal periods when soil moisture is related to fluctuations in vegetation productivity, depicted by correlations between NDVI and SWP, 2001–2014. Panel D. Average daily SWP for the current (1970–2010), near future (2020–2059), and long-term future (2060–2099) periods.


Key Findings

Key findings for the Petrified Forest NP sandy loam upland grassland ecosystem include the following:

  • All of the climate models predicted increases in mean monthly and annual temperature in the near-term future (+2.3°C on average), and further increas­es in the long-term future (+5.0°C on average). Models had greater variation in their predictions of both the direction and the amount of future precipitation, especially during the summer and fall.

  • Future soil water availability is projected to decline in the fall, winter, and spring. By the end of the 21st century, average fall/winter soil water potential is expect­ed to drop to approximately -3.0MPa, indicating conditions of extreme water scarcity, and approaching conditions observed in the spring now. Spring soil water availability will likely be less than summer’s, a pattern observed intermit­tently throughout the 20th century.

  • The drying of soils in spring is predicted to occur earlier in the future. In the long-term scenario, this may eliminate the period when soils are moist dur­ing the spring growing season. This will likely have a substantial impact on plant species that rely on soil moisture during the spring.

  • Productivity, as estimated by annual NDVI, is most strongly correlated to soil water potential in summer, underscoring the importance of summer soil moisture.

The full Natural Resource Report, Describing Trends in Past and Future Soil Moisture in the Sandy Loam Upland Grassland Ecosystem in Petrified Forest National Park, is available here.

Back to Results shortcuts

Extensive grassland under a blue sky with hill in the background.
Figure PP-1. Malpais grassland ecosystem in Petroglyph National Monument.

NPS

Study Area: Malpais Grassland Ecosystem in Petroglyph National Monument

The Malpais grassland ecosystem in Petroglyph National Monument (NM) (Figure PP-1) is dominated by black grama (Bouteloua eriopoda) and other shortgrass bunchgrasses including galleta grass (Hilaria jamesii), sand dropseed (Sporobolus cryptandrus) and needlegrass (Hesperostipa neomexicana). Winterfat (Krascheninnikovia lanata) is the most abundant shrub. Soils in this ecosystem are typically classified as sandy clay loam. We used data from soil cores taken from six plots in this ecosystem as inputs to the SoilWat2 model.

The outputs from our model show soil water potential (SWP) for the past, present, and future, and highlight relatively moist and dry periods. These data can be considered in a variety of ways, including climate variability, variability among soil profiles, and relationships with plot-based vegetation monitoring data. Here we present seasonal and temporal patterns in soil water availability in the Malpais grassland ecosystem in Petroglyph NM.

Two part graph. Left: Line graph of soil water potential by season (1920 to 2000). Seasons are: Fall/Winter, Spring and Summer. Right: Box plot of soil water potential by season for the current, near future and long-term future.
Figure PP-2. Historical (A) and future projections (B) of soil water potential (SWP) in the Malpais grassland ecosystem in Petroglyph National Monument.

USGS

Figure PP-2 presents historical (A) and future projections (B) of SWP at intermediate soil depths (20–50 cm) in the Malpais grassland ecosystem in Petroglyph NM for three seasons: fall/winter (October–February), spring (March–June), and summer (July–September). Panel A shows historical annual variability (fine lines) and moving 10-year averages (thick lines) of drying and wetting from 1915–2010. Panel B compares variability amongst years for three time periods, current (C; 1970–2010), near future (N; 2020–2059), and long-term future (L; 2060–2099), grouped by season.

3A-Current and predicted temperature and precipitation; 3B-Monthly mean for NDVI (2001–2014); 3C- periods when soil moisture is related to changes in vegetation productivity; 3D-Average daily SWP for the current period, near future, and long-term future.
Figure PP-3. Panel A-Seasonal climate patterns for Malpais grassland ecosystem in Petroglyph National Monument; Panel B-monthly mean NDVI index; Panel C-correlations between NDVI and SWP; and Panel D-soil water potential for current (1970-2010) and near (2020-2059) and long-term (2060-2099) future.

USGS

In Figure PP-3, Panel A presents average seasonal patterns of climate in the Malpais grassland ecosystem in Petroglyph NM for the current (1970–2010), near future (2020–2059), and long-term future (2060–2099) periods. Panel B shows the monthly mean for normalized difference vegetation index (NDVI, 2001–2014). Panel C shows seasonal periods when soil moisture is related to fluctuations in vegetation productivity, depicted by correlations between NDVI and SWP, 2001–2014. Panel D presents average daily SWP for the current (1970–2010), near future (2020–2059), and long-term future (2060–2099).


Key Findings

Key findings for the Petroglyph NM Malpais grassland ecosystem include the following:

  • All of the climate models predicted increases in mean monthly and annual temperature in the near-term future (+2.3°C on average), and further increas­es in the long-term future (+4.9°C on average). Models had greater variation in their predictions of both the direction and the amount of future precipitation.

  • Future soil water availability is projected to decline throughout the year. By the end of the 21st century, average fall/ winter soil water potential is expected to drop below 3.0 MPa, indicating condi­tions of extreme water scarcity, and approaching conditions similar to those observed in summer now. Spring soil water availability will likely be less than summer’s, a pattern observed intermit­tently throughout the 20th century.

  • The drying of soils in spring is predicted to shorten and then eliminate the period when soils are moist during the spring growing season. This will likely have a substantial impact on plant species that rely on soil moisture during this time of year.

  • Productivity, as estimated by annual NDVI, is most strongly correlated to soil water potential in late spring-early sum­mer, underscoring the importance of soil moisture during this time period.


The full Natural Resource Report, Describing Trends in Past and Future Soil Moisture in the Malpais Grassland Ecosystem in Petroglyph National Monument, is available here.

Back to Results shortcuts

Extensive grassland under a blue sky with shrubby hills in the background.
Figure WL-1. Volcanic upland grassland ecosystem in Wupatki National Monument.

NPS

Study Area: Volcanic Upland Grassland Ecosystem in Wupatki National Monument

The volcanic upland grassland ecosystem in Wupatki National Monument (NM) (Figure WL-1) is dominated by galleta grass (Hilaria jamesii) and black grama (Bouteloua eriopoda). Annual forbs like narrow-leaf goosefoot (Chenopodium leptophyllum) and Russian thistle (Salsola tragus) are sometimes abundant. Soils in this ecosystem are typically classified as sandy clay loam. We used data from soil cores taken from six plots in this ecosystem as inputs to the SoilWat2 model. The volcanic upland grassland is one of two upland ecosystems that the Southern Colorado Plateau Network (SCPN) monitors at Wupatki NM. The second is the mixed sandstone shrubland, which is addressed separately.

The outputs from our model show soil water potential (SWP) for the past, present, and future, and highlight relatively moist and dry periods. These data can be considered in a variety of ways, including climate variability, variability among soil profiles, and relationships with plot-based vegetation monitoring data. Here we present seasonal and temporal patterns in soil water availability in the volcanic upland grassland ecosystem in Wupatki NM.

Two part graph. Left: Line graph of soil water potential by season (1920 to 2000). Seasons are: Fall/Winter, Spring and Summer. Right: Box plot of soil water potential by season for the current, near future and long-term future.
Figure WL-2. Historical (A) and future projections (B) of soil water potential (SWP) in the volcanic upland grassland ecosystem in Wupatki National Monument.

USGS

Figure WL-2 presents historical (A) and future projections (B) of SWP at intermediate soil depths (20–50 cm) in the volcanic upland grassland ecosystem in Wupatki NM for three seasons: fall/winter (October–February), spring (March–June), and summer (July–September). Panel A shows historical annual variability (fine lines) and moving 10-year averages (thick lines) of drying and wetting from 1915–2010. Panel B compares variability amongst years for three time periods, current (C; 1970–2010), near future (N; 2020–2059), and long-term future (L; 2060–2099), grouped by season.

3A-Current and predicted temperature and precipitation; 3B-Monthly mean for NDVI (2001–2014); 3C- periods when soil moisture is related to changes in vegetation productivity; 3D-Average daily SWP for the current period, near future, and long-term future.
Figure WL-3. Panel A-Seasonal climate patterns for volcanic upland grassland ecosystem in Wupatki National Monument; Panel B-monthly mean NDVI index; Panel C-correlations between NDVI & SWP; Panel D-soil water potential for current (1970-2010) and near (2020-2059) and long-term (2060-2099) future.

USGS


In Figure WL-3, Panel A presents average seasonal patterns of climate in the volcanic upland grassland ecosystem in Wupatki NM for the current (1970–2010), near future (2020–2059), and long-term future (2060–2099) periods. Panel B shows the monthly mean for normalized difference vegetation index (NDVI, 2001–2014). Panel C shows the seasonal periods when soil moisture is related to fluctuations in vegetation productivity, depicted by correlations between NDVI and SWP, 2001–2014. Panel D shows the average daily SWP for the current (1970–2010), near future (2020–2059), and long-term future (2060–2099) periods.


Key Findings

Key findings for the Wupatki NM volcanic upland grassland ecosystem include the following:

  • All of the climate models predicted increases in mean monthly and annual temperature in the near-term future (+2.4°C on average), and further increas­es in the long-term future (+4.9°C on average). Models had greater variation in their predictions of both the direction and the amount of future precipitation.

  • Future soil water availability is projected to decline in the fall, winter, and spring. By the end of the 21st century, average predicted fall/winter soil water poten­tial drops below -1.5 MPa, indicating potential water stress and approaching conditions similar to those currently experienced in spring. Average spring soil water potential is expected to drop below -3.0 MPa, indicating conditions of extreme water scarcity, and surpass­ing conditions currently experienced in summer.

  • The drying of soils in spring is predicted to occur earlier, particularly in the long-term scenario. This will shorten the period when soils are moist during the spring growing season and will likely have a substantial impact on plant spe­cies that rely on spring soil moisture.

The full Natural Resource Report, Describing Trends in Past and Future Soil Moisture in the Volcanic Upland Grassland Ecosystem in Wupatki National Monument, is available here.

Back to Results shortcuts

Extensive shrubland with hills and mountains in the distance.
Figure WS-1. Loamy upland shrubland ecosystem in Wupatki National Monument.

NPS

Study Area: Loamy Upland Shrubland Ecosystem in Wupatki National Monument

The loamy upland shrubland ecosystem in Wupatki National Monument (NM) (Figure WS-1) is characterized by large areas of galleta grass (Hilaria jamesii) interspersed with shrubs, primarily Apache plume (Fallugia paradoxa), Mormon-tea (Ephedra torreyana), and sand sage (Artemisia filifolia). Soils in this ecosystem are typically classified as a sandy loam, with a large gravel component. We used data from soil cores taken from 30 Southern Colorado Plateau Network (SCPN) monitoring plots in the mixed sandstone ecosystem as inputs to the SoilWat2 model. The loamy upland shrubland is one of two upland ecosystems that SCPN monitors at WUPA. The second is the volcanic upland grassland ecosystem, which is addressed separately.

The outputs from our model show soil moisture potential (SWP) for the past, present, and future, and highlight relatively moist and dry periods. These data can be considered in a variety of ways, including climate variability, variability among soil profiles, and relationships with plot-based vegetation monitoring data. Here we present seasonal and temporal patterns in soil water availability in the loamy upland shrubland ecosystem in Wupatki NM.

Two part graph. Left: Line graph of soil water potential by season (1920 to 2000). Seasons are: Fall/Winter, Spring and Summer. Right: Box plot of soil water potential by season for the current, near future and long-term future.
Figure WS-2. Historical (A) and future projections (B) of soil water potential (SWP) in the loamy upland shrubland ecosystem in Wupatki National Monument.

USGS

Figure WS-2 presents historical (A) and future projections (B) of SWP at intermediate soil depths (20–50 cm) in the loamy upland shrubland ecosystem in Wupatki NM for three seasons: fall/winter (October–February), spring (March–June), and summer (July–September). Panel A shows historical annual variability (fine lines) and moving 10-year averages (thick lines) of drying and wetting from 1915–2010. Panel B compares variability amongst years for three time periods, current (C; 1970–2010), near future (N; 2020–2059), and long-term future (L; 2060–2099), grouped by season.

- 3A-Current and predicted temperature and precipitation; 3B-Monthly mean for NDVI (2001–2014); 3C- periods when soil moisture is related to changes in vegetation productivity; 3D-Average daily SWP for the current period, near future, and long-term future
Figure WS-3. Panel A-Seasonal climate patterns for the loamy upland shrubland ecosystem in Wupatki National Monument; Panel B-monthly mean NDVI index; Panel C-correlations between NDVI and SWP; and Panel D-soil water potential for current (1970-2010) and near (2020-2059) and long-term (2060-2099) fu

USGS


In Figure WS-3, Panel A presents average seasonal patterns of climate in the loamy upland shrubland ecosystem in Wupatki NM for the current (1970–2010), near future (2020–2059), and long-term future (2060–2099) periods. Panel B shows monthly mean for normalized difference vegetation index (NDVI, 2001–2014). Panel C shows seasonal periods when soil moisture is related to fluctuations in vegetation productivity, depicted by correlations between NDVI and SWP, 2001–2014. Panel D shows average daily SWP for the current (1970–2010), near future (2020–2059), and long-term future (2060–2099) periods.


Key Findings

Key findings for the Wupatki NM loamy upland shrubland ecosystem include the following:

  • All of the climate models predicted increases in mean monthly and annual temperature in the near-term future (+2.4°C on average), and further increas­es in the long-term future (+4.9°C on average). Models had greater variation in their predictions of both the direction and the amount of future precipitation.

  • Future projections suggest declining soil water availability, particularly in the fall, winter, and spring. By the middle of the 21st century, average predicted fall/winter soil water potential drops below -3.0 MPa, indicating conditions of extreme water scarcity. Spring soil water availabil­ity also significantly declines, surpassing conditions currently experienced in summer, a pattern observed intermittently throughout the 20th century.

  • The drying of soils in spring is predicted to occur earlier in both scenarios, and will shorten or eliminate the period when soils are wet during the spring growing season. This will likely have a substantial impact on plant species that rely on this soil moisture.

  • Productivity, as estimated by annual NDVI, is most strongly correlated to soil water potential in summer, underscoring the importance of summer soil moisture.

The full Natural Resource Report, Describing Trends in Past and Future Soil Moisture in the Loamy Upland Shrubland Ecosystem in Wupatki National Monument is available here.

Back to Results shortcuts

References

Kolb, K. J., and J. S. Sperry. 1999a. Differences in drought adaptation between subspecies of sagebrush (Artemisia tridentata). Ecology, 80:2373–2384.

Kolb, K. J., and J. S. Sperry. 1999b. Transport constraints on water use by the great basin shrub, Artemisia tridentata. Plant, Cell and Environment, 22:925–935.

Livneh B., E. A. Rosenberg, C. Lin, B. Nijssen, V. Mishra, K. M. Andreadis, E. P. Maurer, and D. P. Lettenmaier. 2013. A Long-Term Hydrologically Based Dataset of Land Surface Fluxes and States for the Conterminous United States: Update and Extensions, Journal of Climate, 26, 9384–9392.

Walter, H., and H. Leith. 1967. Climate diagram world atlas. Fischer Verlag, Jena, Thuringia, Germany.

Aztec Ruins National Monument, Bandelier National Monument, Chaco Culture National Historical Park, Glen Canyon National Recreation Area, Grand Canyon National Park, Mesa Verde National Park, Petrified Forest National Park, Petroglyph National Monument, Wupatki National Monument more »

Last updated: January 12, 2023